RESULTS
We found several clusters and we analyzed seven of them that had a significant number of pedestrian-vehicle collisions in Greater Vancouver illustrated in the next figure. The accidents recorded were instances where the injured pedestrain was hospitalized with a severe injury of twelve or greater accordingly to the Injury Severety Score, that is an anatomical scoring system used by medical practitioners to mearsure the degree of trauma in patients.
Click on each of the clusters to find more specific information.
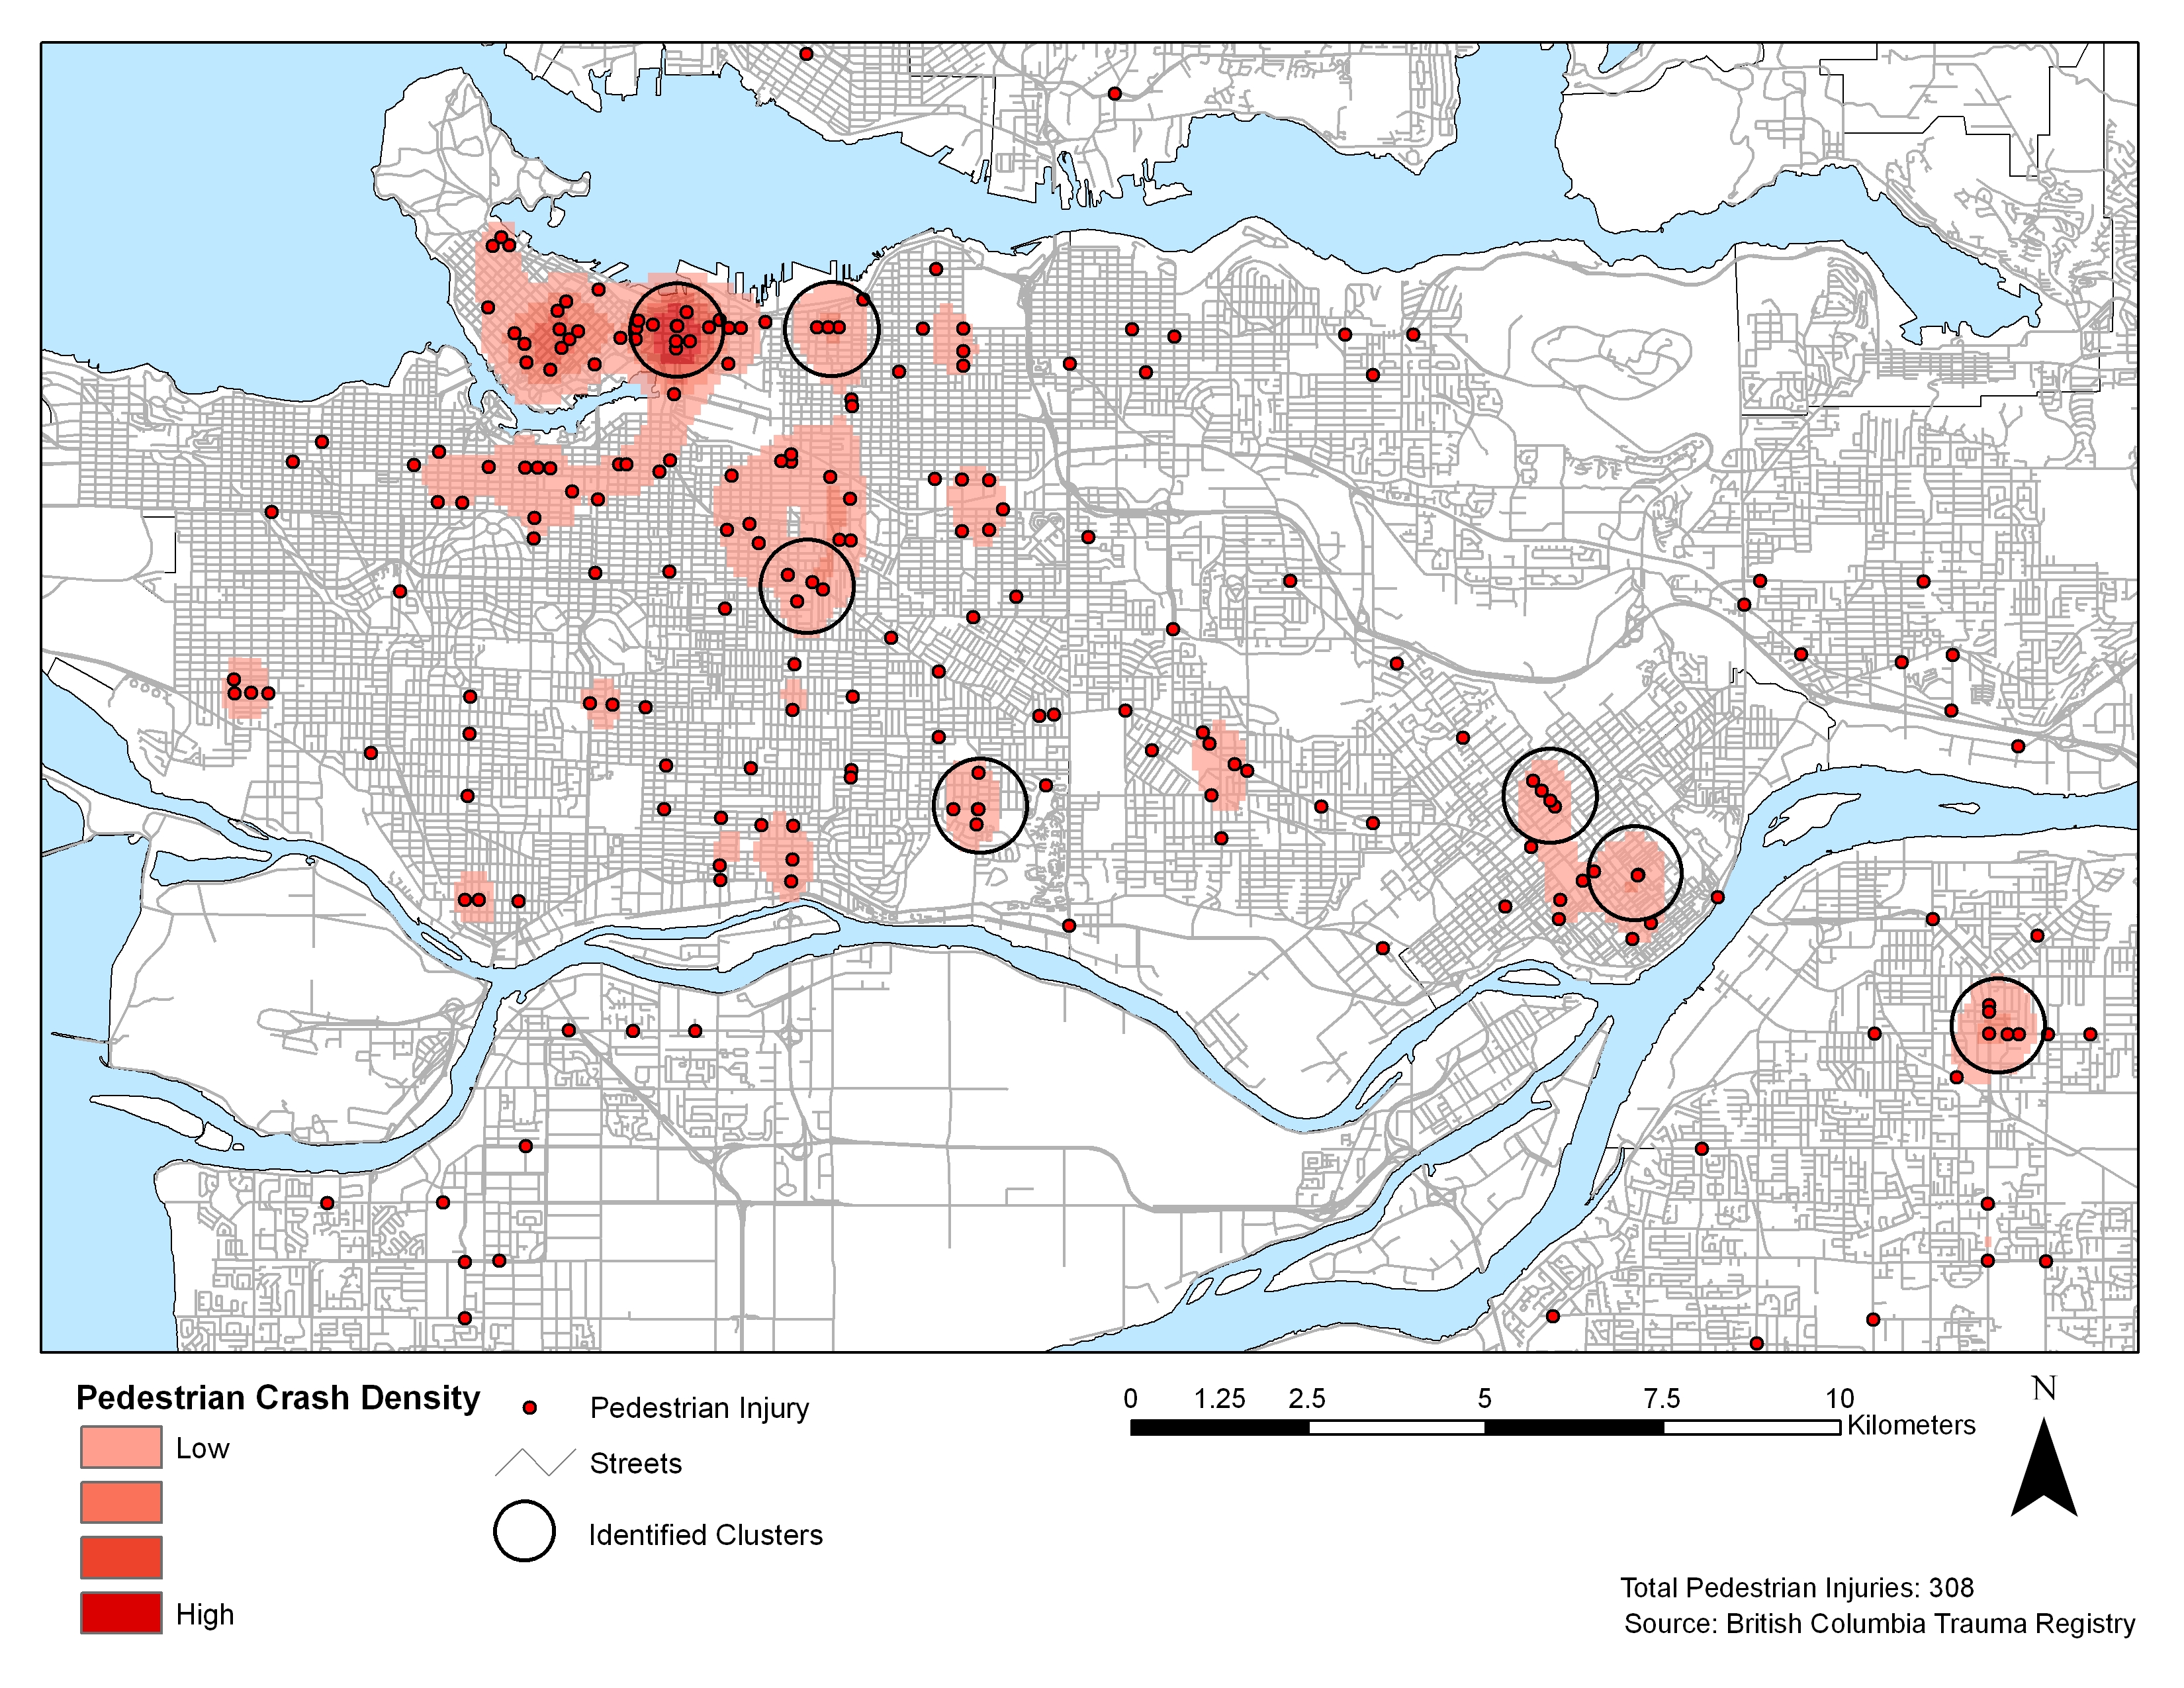
Vancouver is the city with the most clusters with a total of four, Surrey, Burnaby and New Westminster all had one cluster. Some clusters are not located at a single junction but were composed of more than one intersection. This is primarily due to the sparsely distributed crash data throughout Greater Vancouver. Click on each clusters to see further details.
Interestingly the scores for intersections did not have a direct positive relationship. This is evident in the following graph showing that the higher number of accidents did not happen at clusters with higher scores based in our weighting system described in the methodology section.

It is apparent based on the intersections attended and the weighting scheme used that there is an inverse relationship between the score and the number of injuries. The higher the intersection scored for risk, the lower the number of injuries that occurred. In contrast, the lower the score at an intersection, the greater the number of injuries that occurred. For instance, Main and Hastings had the lowest risk score, but had the highest number of incidents. This relationship could be due to a number of reasons, for instance higher traffic flows, poorer neighbourhoods and the perception of safety. These factors were outside the scope of this paper and therefore not accounted for in our analysis