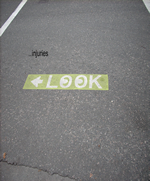
METHODOLOGY
There were two objectives in our project on pedestrian injuries in Greater Vancouver. The first objective was to locate ‘hotspots’ of pedestrian-motor vehicle collisions and the second was to evaluate the elements of the built environment that are linked to pedestrian injury. Every ‘hotspot’ was given a weighted score based on a number of identified attributes that contributed to risk. The total weighted values were then compared to the total number of injuries to explore any relationships between data.
Outline of Methodology:
1. Our technique included using a GIS to map collisions involving pedestrian and motor-vehicles in the Greater Vancouver Area. In order to map clusters we extrapolated collision data from the British Columbia Trauma Registry which served as our main data source.
All pedestrian traffic related injuries that occurred between 2000-2005 in Vancouver were extracted from the BCTR. This included a total of 308records of crash data for our analysis. It must be noted that the total number of injuries used in this project does not reflect the total number of incidents that occurred over the five years, as the BCTR data only included serious collisions where pedestrians were taken to hospital.
2. The next step required geocoding the BCTR point data, using the DMTI Canadian Road Network from Simon Fraser University’s Spatial Information Data Warehouse. The road network was clipped to the Greater Vancouver census subdivision. To geocode the BCTR, address of incidence was applied using a standard ESRI ArcMap geocode function and was matched to intersections.
3.Based on previous cluster analysis involving pedestrian injury, we found that using the kernel method was the most effective at identifying injury clusters as data was geocoded to intersections and may obscure overlapping records . Applying this method resulted in an interpolated density surface of incidence.
To uncover other areas of interest, we reclassified the raster surface of incident density to obtain a final result of seven major regions or hot spots. Multiple intersections were then identified within hotspots for the fieldwork portion of the study.
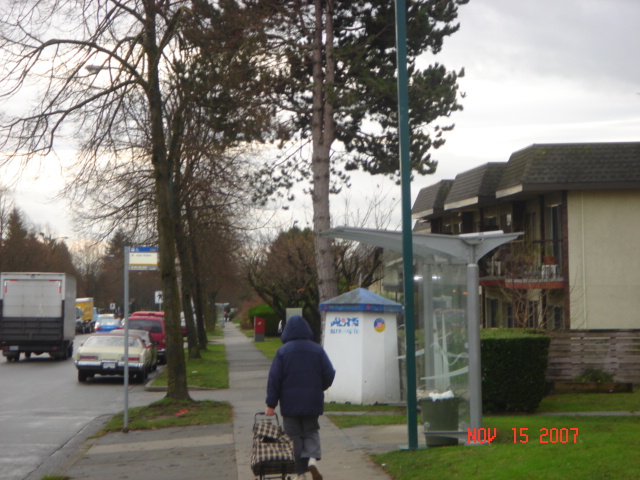
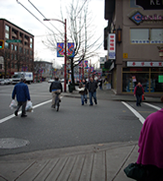
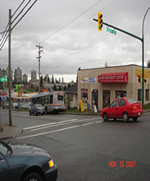
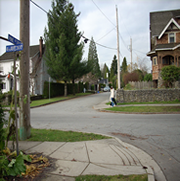
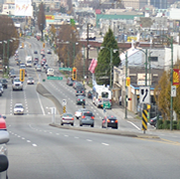
Field work:
The next phase of the project included evaluating each location and obtaining photographic documentation. Hotspots included a string of pedestrian injuries at intersections along a stretch of road, however, for the purposes of the assessment the centre intersection of the hotspot or the intersection with the most incidents was used in the evaluation.
A checklist with a total of 13 factors was used to assess each intersection. Each factor was subjectively weighted based on the significance it had of increasing or decreasing the risk. We gave weights based on our literary review and on our belief of how does the physical elements influence the risk. The weighting schema and the number of factors are shown in the following table:
Summary of Factors and associated Weights
Factors |
Weights |
Parked cars |
10 |
Bus stops |
2 |
Visually obstructive flora |
10 |
Absence of crosswalk lighting |
8 |
Absence of marked crosswalk |
6 |
Long distances between intersections/crosswalks |
14 |
Absence of traffic calming measures |
10 |
T-intersection |
15 |
Street has more than one lane |
11 |
Absence of a sidewalk |
5 |
Hilly road |
2 |
Winding road |
3 |
Absence of a meridian |
4 |
Total |
100 |