Background
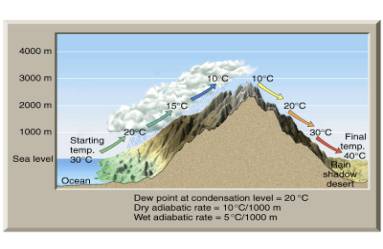
There will be six different criteria used in this project: precipitation, average temperature, snowfall, wind, sea-level rise, and Fraser River flood. Weather in Vancouver is dominated by the interaction of air moving in from the Pacific Ocean and being forced upwards upon colliding with the Coastal Mountains. As air rises it cools, condenses, and results in precipitation on the upslope side (as diagramed bellow). As a result of these processes it is expected that temperature, rainfall, and snowfall will have a wide variation across the region. In order to account for this, point weather data will be observed to look for trends with elevation, distance from the ocean, and distance from the mountains.

Image from the University of Illinois
The analysis of trends in wind strength during storms will be more complex because wind is highly spatially variable. Mitchell (2004) used GIS to represent the exposure of slopes by defining a “topex” value for each point that represented the sum of the angle to the skyline in each direction. Topex allows for a definition of exposure in all directions, but for this project the focus will be on the exposure to a dominant wind direction. Considerations will be made as to the aspect and slope, where areas with steep slopes and aspects that are inline with the dominant wind direction will have the greatest exposure.
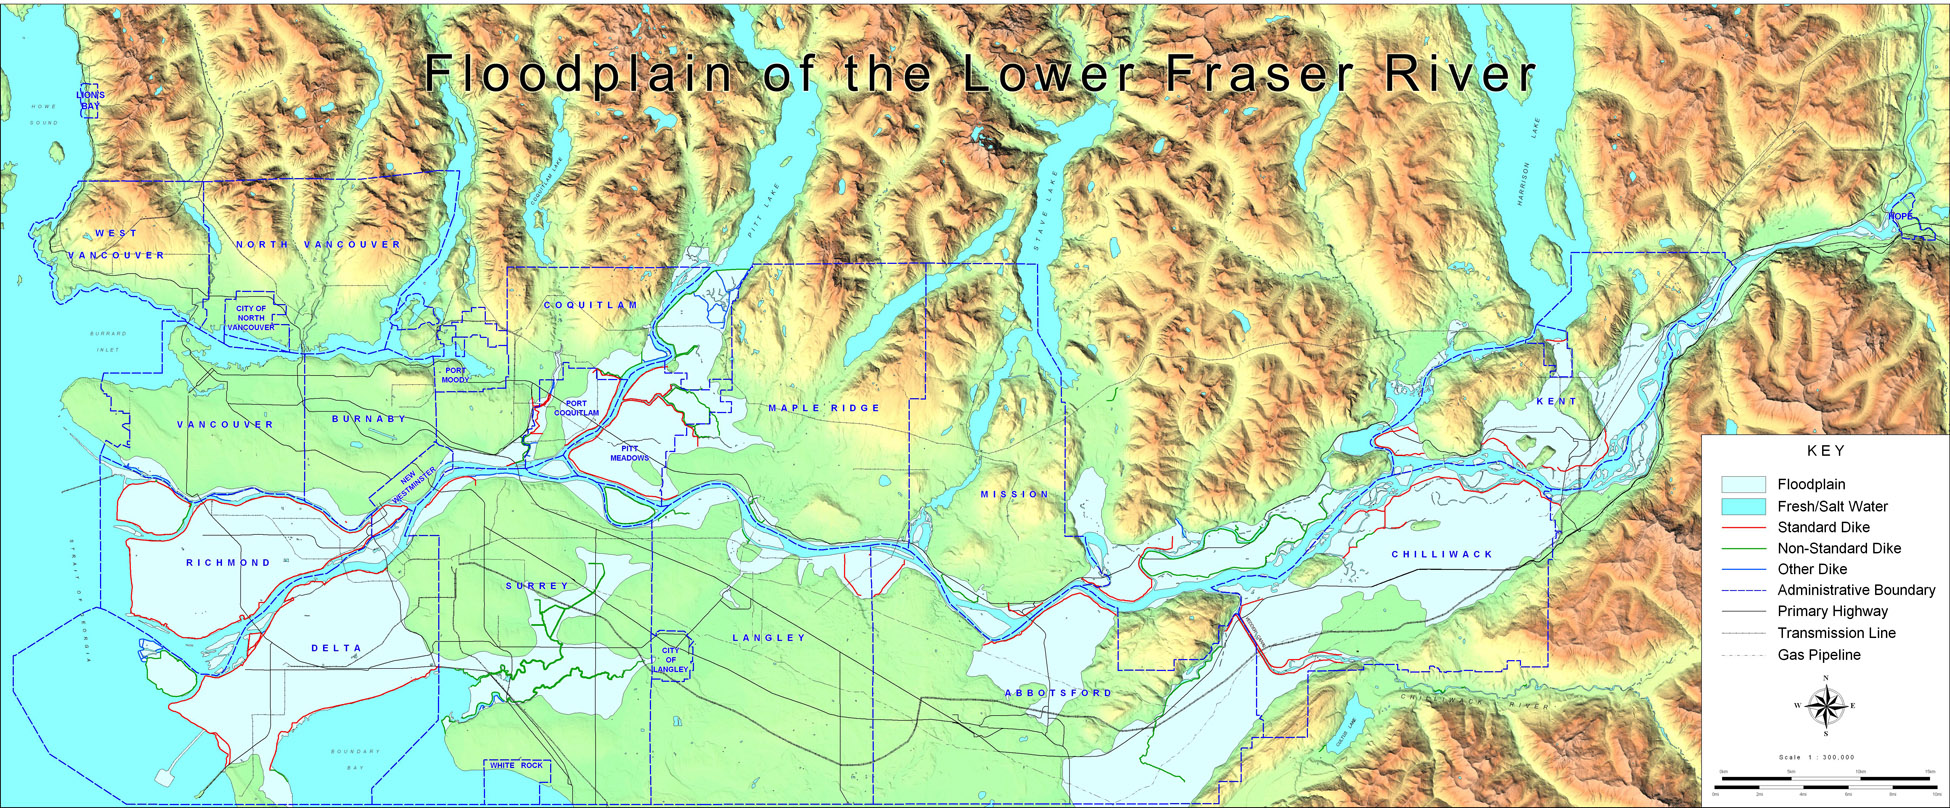
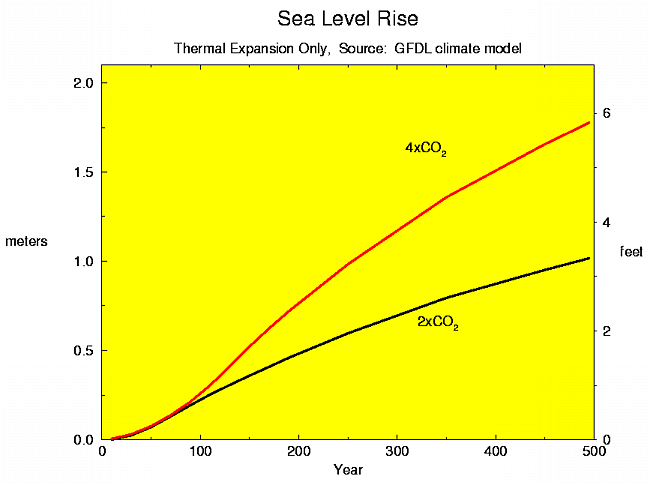
The sea-level rise and Fraser River flood potentials are similar in the fact that having the lowest elevation is the source of greatest risk. Identifying areas of risk for floods is not just as simple as elevation though because if a low lying area is protected by higher land, this needs to be taken into consideration. Previous research will be relied on heavily for the potential magnitude of both these events including the map bellow showing the extent of the Fraser floodplain. There is known to be about 7m of sea-level rise contained within the continental ice of Greenland and another 73m if all the ice in the Antarctic were to melt (NOAA, 2008). In addition, without any melting of ice the graph bellow shows that there could be upwards of 0.5m of rise over the next 100 years due to temperature increase causing thermal expansion.

Image from Fraser Basin Council

Image from NOAA