Discussion and Results
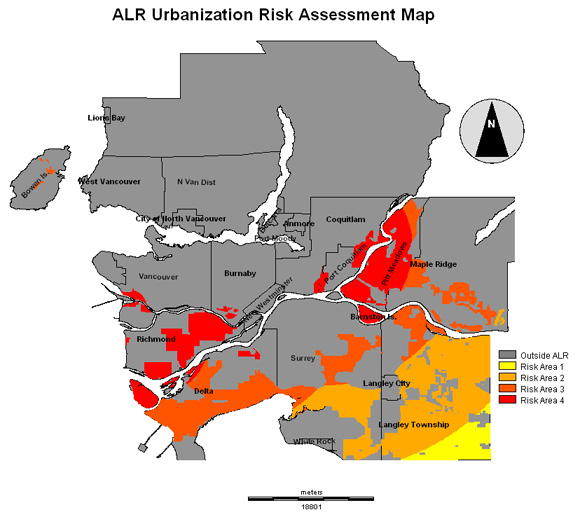
A map of the location of ranked risk areas from 1 to 4, low to high, was assembled from the results of the MCE analysis. From this information, it is possible to revisit the data collected that describes the percentage of total ALR Land per Municipality in Metro Vancouver.
The following chart uses the information derived from the risk assessment analysis and shows that the ALR exists under different conditions within each municipality. This information shows which local governments are possibly dealing with the greatest level of urban and agricultural conflict, and consequently shouldering greater responsibilities to protect agricultural farmland at a provincial level in addition to satisfying local development goals.
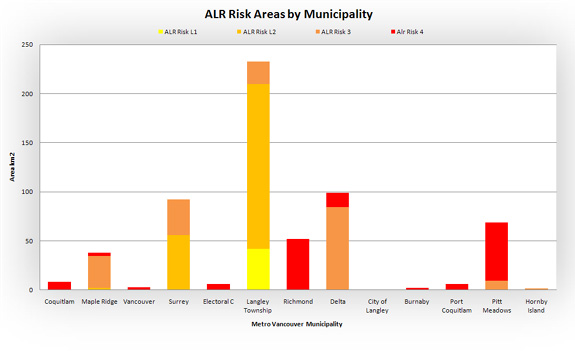
This kind of information could be used for local land management and planning, as well as designing regional and provincial development strategies. Knowing where the the greatest areas of conflict between urban and rural land use addresses issues of smart growth and can serve to alter the perception of our agricultural land base from being viewed as merely empty space.