Methodology
IDRISI was used to make a multi-criteria evaluation. The steps and maps below demonstrate the data that was used and how it was manipulated to illustrate the desired results. Constraints and factors were used in Decision Wizard to create suitable areas. The 2 constraints were landcon and roadcon. The 7 factors chosen were major roads, bus stops, skytrain stations, population, income, mode of transportation, and Starbucks locations. All the different constraints and factors were made throught the use of ASSIGN, RECLASS, and DISTANCE modules. The constraints and factors were then put into a FUZZY module to create fuzzy map for the MCE.
Macro modeler
The macro modeler above illustrates how the imported vector files were converted to raster images in IDRISI. Then the DISTANCE moduel was use to calculate distance for the bus stop, skytrain station, Starbucks and major road layers that required it for later spatial analysis.
Factor and constraint maps
Constraints
Landusecon
The GRVD landuse map was ASSIGN into suitable or unsuitable land. Areas that were commercial, commercial-resisdential mixed, open and undeveloped, and resisdential-townshouse/low-rise apartments, were ASSIGNED a value of 1 with all other areas receiving a value of 0.
The distance module was used to find the distance from major roads and then all areas within 150 meters was RECLASSED a value of 1 with any distances greater then BLANK receiving a value of 0.
The Census data for population was aggregated into people aged 25-60 years old. They were then selected, as that is the age of most working individuals, and divided by the rest of the population to give a ratio of people aged 25-60 living in each DA. The reason for this was that I believe that this demographic would consume that largest amount of coffee and other goods on their way to work.
The Census data for income should the amount of people who make over 20,000 after tax. The data was aggregate to select people making over 20,000 after tax divided by the total amount of people making an after tax income. This gave a ration of the amount of people in each DA making over 20,000 dollars.
The Census data for mode of transportation showed people who drive to work and other modes of transportation to get to work such as public transit and walking. The amount of people who walk and take public transit to work was divided by the amount the rest of the people who go to work. This gave a ratio of people would walk or take public transit to work.
The distance module was used to find the distance from bus stops in Vancouver.
The distance module was used to find the distance from skytrain stations in Vancouver.
A distance module was used to find the distance from major roads in Vancouver
The Starbucks locations were geocoded and then the distance module was used.
Fuzzy Maps
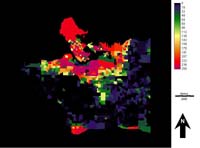
Below are the FUZZY sets and FUZZY maps that were created in IDRISI Decision Wizard to give suitability to certain qualities of certain maps. The population, mode of transportation and income maps were given suitability on the percent of people who matched the criteria above and the bus stops, skytrain stations, major roads and Starbucks distance maps were given suitability based on there distance from one of the features. The maps show the suitability of areas on a scale of 0 to 255, with 255 being the highest suitability.
Fuzzy maps

A FUZZY map showing the areas that have the highest suitability for population with people between the ages of 25 and 60 years old. The map gives suitability to areas that have 50 percent of the population between 25 to 60 years old increasing to 75 percent where from 75 to 100 percent they are given almost equal suitability.
A FUZZY map showing the areas that have the highest suitability for income and selecting areas based on the factor that they have a minimum of 50 percent of the population making 20,000 dollars have tax with increasing suitability up 75 percent. Any percent great then 75 percent is considered to be approximately equal in suitability.
A FUZZY map showing the mode of transportation people take to go to work. It shows the suitability of areas depending on the amount of people who either walk or take public transit to work. The suitability is based on the percent of people who walk or take public transit to work, and then a FUZZY suitability is given to the percent. The lowest suitability is givent to areas with 50 percent of th population walking or taking public transit to work. Suitability increases to 85 percent of the population, and then any areas over 85 percent are considered to have approximately equal suitability.
A FUZZY map illustrating the suitability of areas based the distance they are from bus stops. The suitability in the FUZZY module was based on a mono decreasing J-shaped function with all ares with 100 meters being equality suitable, and any distances further away receiving less suitability. The reason I chose 100 meters is due to the fact the there is high density of bus stops in Vancouver and in my experience I would want the coffee shop as close as possible to the bus stop as possible.
The FUZZY map for skytrain stations shows the suitability of areas based on the distance they are from a skytrain station. The skytrain station FUZZY map suitability is based areas within 100 meters being considered almost equally equal and decreasing to 800 meters. The reason that skytrain station were given a suitability with a large range of distances is based of the assumption that due to the fact that their are less skytrain stations people would be willing to farther to get to a coffee shop. However, anything over 800 meters would be to far for some to walk to get coffee and they would probbably go another coffee shop, so 800 meters was the farthest distance given suitability.
The FUZZY map for major roads shows the suitability areas based on the distance they are from a major road. The major roads FUZZY map is based on a scale of suitability from 0 to 255, with 255 being the highest suitability.
The FUZZY map for Starbucks locations shows the suitability associated with being a certain distances from a Starbucks. The maps used a symmetric sigmoidal FUZZY analysis with the control points set at zero suitability given to any locations within 100 meters or further then 500 meters of a Starbucks. A location between 150 and 300 was considered approximatily equal with decreasing suitability outside of those two control points. The reason that I did this was based on the fact that Starbucks is a large coffee company which is highly successful. I wanted to be close to a Starbucks because they locate in high tariff areas but I wanted to be far enough away as not to lose business to them.


