Spatial Analysis and Results
In a WLC, weights are assigned to each factor. I used the Decision Wizard function to assign weights and produce the MCE results.
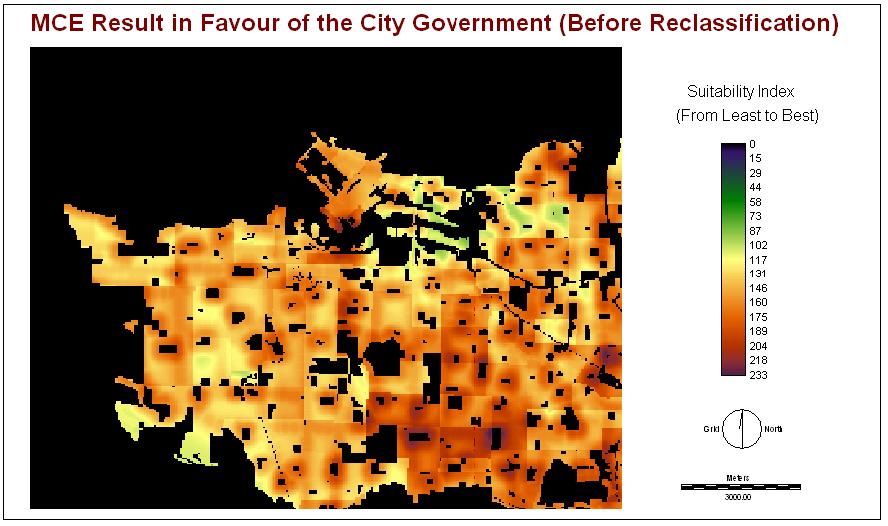
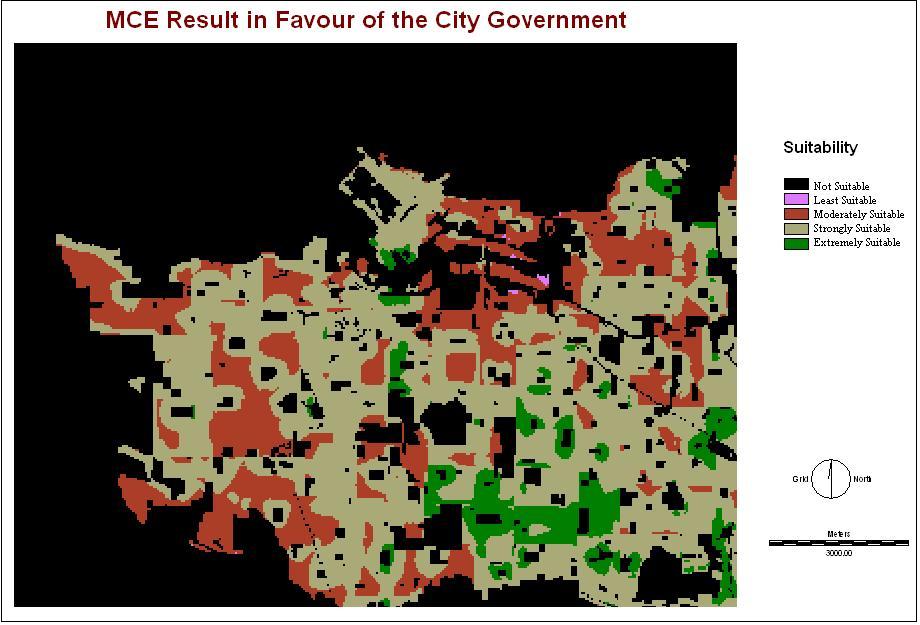
Model 1: In favour of the muncipal government
| under6fuzz | parkfuzz | landusevalue | industfuzz | streetfuzz | hubdistfuzz | employfuzz | hoursfuzz | spacefuzz | busfuzz | skyfuzz | |
| under6fuzz | 1 | ||||||||||
| parkfuzz | 1 | 1 | |||||||||
landusevalue |
1/3 | 1/3 | 1 | ||||||||
| industfuzz | 1 | 1 | 3 | 1 | |||||||
| streetfuzz | 1/3 | 1/3 | 1 | 1/3 | 1 | ||||||
| hubdistfuzz | 1 | 1 | 5 | 1 | 1 | 1 | |||||
| employfuzz | 1 | 1 | 1 | 1 | 1 | 1 | 1 | ||||
| hoursfuzz | 1/3 | 1/3 | 1 | 1/3 | 1 | 1/3 | 1 | 1 | |||
| spacefuzz | 1/3 | 1/3 | 1 | 1/3 | 1 | 1/3 | 1 | 1 | 1 | ||
busfuzz |
1/3 | 1 | 1 | 1 | 1 | 1 | 1 | 1 | 1 | 1 | |
| skyfuzz | 1/3 | 1 | 1 | 1 | 1 | 1 | 1 | 1 | 1 | 1 | 1 |
The eigenvector of weights is :
under6fuzz : 0.1528
parkfuzz : 0.1260
landusevalue : 0.0545
industfuzz : 0.1260
streetfuzz : 0.0631
hubdistfuzz : 0.1245
employfuzz : 0.0864
hoursfuzz : 0.0559
spacefuzz : 0.0559
busfuzz : 0.0776
skyfuzz : 0.0776
Consistency ratio = 0.04
Consistency is acceptable.
I assigned higher weight in children population, park distance, industry distance, and hub distance. These factors were highlighted according to the City's Guidlines.
The results were reclassified into 5 categories as shown below:
| Assigned Value | From Value | To Value | Category |
| 0 | 0 | 46 | Not Suitable |
| 1 | 46 | 92 | Least Suitable |
| 2 | 92 | 139 | Moderately Suitable |
| 3 | 139 | 185 | Strongly Suitable |
| 4 | 185 | 999 | Extremely Suitable |
Model 2: In favour of business
| under6fuzz | parkfuzz | landusevalue | industfuzz | streetfuzz | hubdistfuzz | employfuzz | hoursfuzz | spacefuzz | busfuzz | skyfuzz | |
| under6fuzz | 1 | ||||||||||
| parkfuzz | 1/3 | 1 | |||||||||
landusevalue |
1/3 | 1/3 | 1 | ||||||||
| industfuzz | 1/3 | 1 | 1 | 1 | |||||||
| streetfuzz | 1 | 3 | 3 | 3 | 1 | ||||||
| hubdistfuzz | 1/3 | 1 | 1 | 1 | 1/3 | 1 | |||||
| employfuzz | 1 | 1 | 1 | 3 | 1 | 3 | 1 | ||||
| hoursfuzz | 1 | 3 | 1 | 3 | 1 | 3 | 1 | 1 | |||
| spacefuzz | 1 | 3 | 1 | 3 | 1 | 3 | 1 | 1 | 1 | ||
busfuzz |
1 | 1 | 1 | 1 | 1 | 3 | 1 | 1 | 1 | 1 | |
| skyfuzz | 1 | 1 | 1 | 1 | 1 | 3 | 1 | 1 | 1 | 1 | 1 |
The eigenvector of weights is :
under6fuzz : 0.1247
parkfuzz : 0.0416
landusevalue : 0.0732
industfuzz : 0.0536
streetfuzz : 0.1247
hubdistfuzz : 0.0416
employfuzz : 0.1119
hoursfuzz : 0.1119
spacefuzz : 0.1119
busfuzz : 0.1025
skyfuzz : 0.1025
Consistency ratio = 0.03
Consistency is acceptable.
I assigned higher weights to children population, major streets proximity, employed population, hours spent without pay, and preschool space from a point of view of gaining more profit.
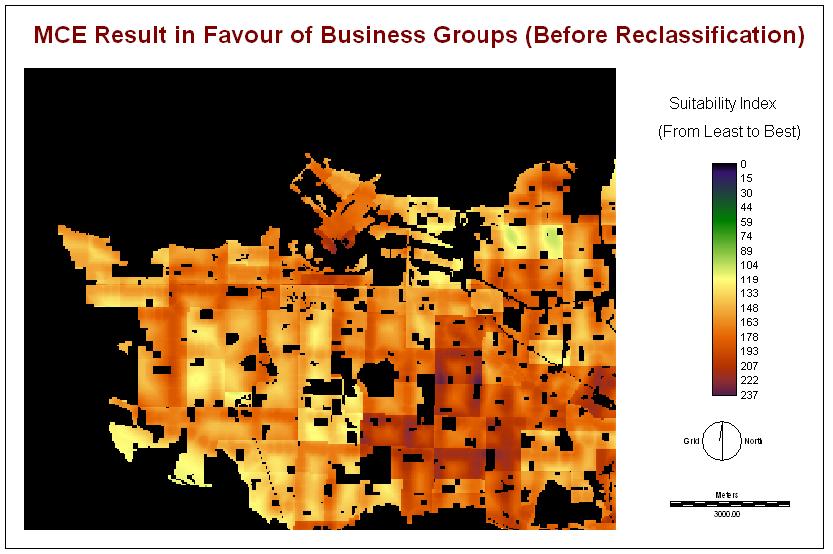
The results were reclassified into 5 categories as shown below:
| Assigned Value | From Value | To Value | Category |
| 0 | 0 | 46 | Not Suitable |
| 1 | 46 | 94 | Least Suitable |
| 2 | 94 | 141 | Moderately Suitable |
| 3 | 141 | 189 | Strongly Suitable |
| 4 | 189 | 999 | Extremely Suitable |
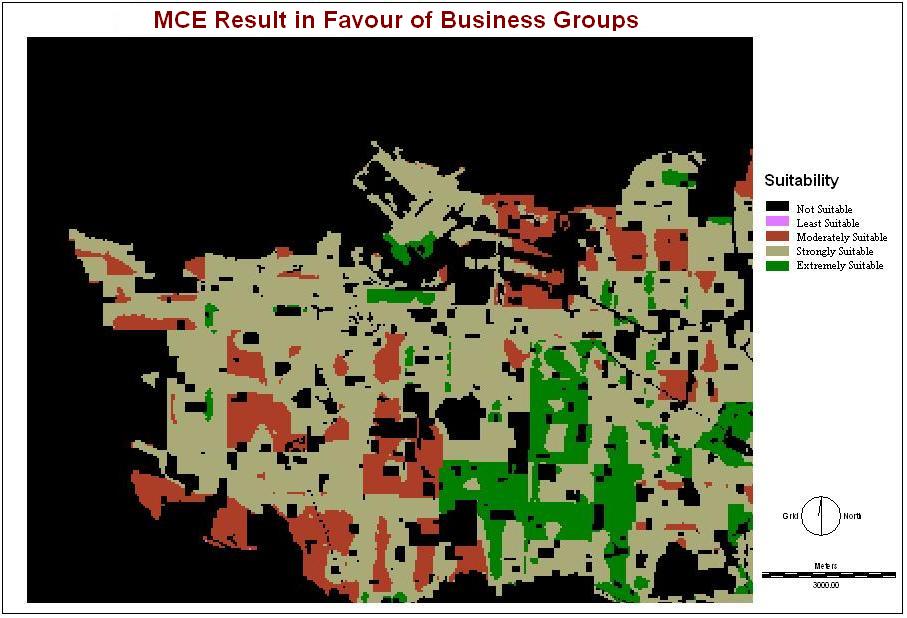
Both models have shown that there was a consistency of extremely suitable area in southern downtown area, central and southerneastern Vancouver. These places included Oakridge, Sunset, Kilarnery, Renfrew-Collingwood, and Fairview area. The business model showed more extremely suitable area than the government model. Considerations for a preschool should be made in the extremely suitable area.
Next to Problems and Discussion