|
Operational and Methodological Errors: |
Errors occur in the processes of data preparation and spatial analysis. Data errors are generated in rasterization of vector data, data processing, data standardization and spatial operations. Inherent data errors are revealed in data processing. The analysis method applied in this project also has its shortcoming.
Data lost in rasterization
When converting vector data to raster data in ArcToolbox and ArcMap, some data in the census data layers are lost. It is because the sizes of some dissemination area units (DAU) are very small, when rasterizing these small DAU polygon, their areas cannot be recognized as a pixel. This problem is realized when converting polygon features to raster in ArcToolbox. The census data layer is rasterized based on the field of DAUID in the attribute table. Nine DAU polygons with area below 370 square meters are not recognized in the rasterization process because each pixel represents 20m X 20m area. In the new census image, these nine DAUs and their attribute values are lost. Where did they go? One speculation is that they are dissolved to their neighbor DAU pixels.
Operation caused error: data error propagation
The raster layer of DAUID is used to calculate the area in IDRISI by the "GROUP" and "AREA" modules. However, error occurs in this process and image noise (isolated pixels) was generated. The error is realized when comparing the result of population density computed in IDRISI with the result in ArcMap attribute table. In ArcMap, if excluded the nine lost DAUs, the largest number of the population density is 1142 people per hectare. This number is correct and true because it is obtained by using mathematical operations in the attribute table. The largest number computed in IDRISI modules is 18400 people per hectare, which is 16 times larger. The reason why arguing this largest number is generated by image noise is because extremely largest numbers are yielded in division only when the divisor is an extremely small number relative to the dividend. Image noise composed of small isolated pixels represents small area. Any cell values in a raster image divided by these small area values will get very largest numbers. In order to identify the noises, the population density image is reclassed that all value above 1142 is assigned 1 and the rest is 0. The result is shown as follow.
The white dots on the map are the image noises, and they are locate on the edge of the study area. In the DAUID image there are six DAUs and each of them is represented by one isolated pixel, but they are not image noise and would not cause error. Since the area layer is overlay with other census data layers correctly, the six result cell values in the new image will be zero because such DAUs have no population.
In this project, three census data layers are needed to be standardized and computed their population densities. All of them are affected by the image noise and the abnormally largest values are generated.
Inherent data error: statistical error
The first method used to compute the population density of the three target groups are unintelligent. This method is first to divide the target group population by the total population to get the ratio, and then multiply the ratio to the population density. However, in this process the inherent data error is discovered. The ratio of target group to total population should not larger than one because the target group is the subset of the total population and should not be larger than that. But, in the images showing the proportion of immigrants to total population and the proportion of population with secondary education to total population have ratio slightly larger than 1.
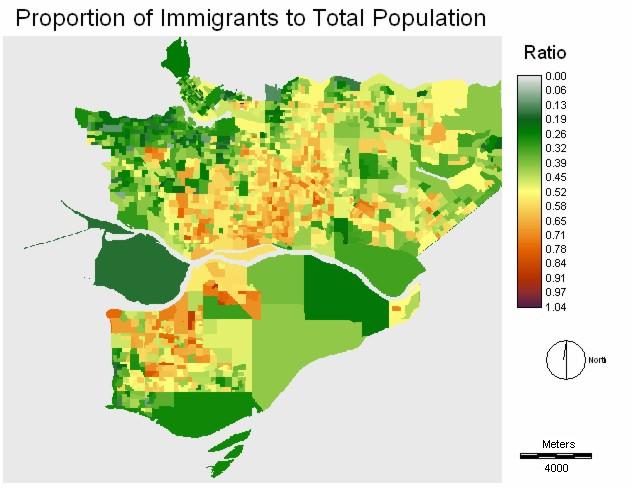
This error is statistical because the data collection methods for immigrant and education information are random sampling based on sample of 20 percent of the population (This information is stated in the additional details attached to the data table), while the total population data is collected from the whole population. The source of this error is understandable by a simple example. If a DAU has population of 103, surveyors need to have 21 samples so that they have enough 20% of the population. If an answer of a survey question for all 21 samples is positive, the statistic analysts will interpret 105 (21x5) people in this DAU have positive respond to this question, that is larger than the real total population of 103 people and is not true.
Methodological error: the shortcoming of Analytical Hierarchy Decision Process
It was frustrating when discovering there are contradictions between ratings of factors in the pairwise comparison matrix. For example, the rating of land use selection over proximity to Skytrain stations is 1, and the rating of the same factor over proximity to bus routes is 1. These two ratings imply proximities to Skytrain stations and bus routes are equally important. But, the rating of proximity to bus route over skytrain is 3, that means the former is important to the later and is contradiction. Such contradictions also occur to other ratings.
Pairwise comparison is useful to generate weight by assigning ratings between factors, but in fact users are not freely to assign the ratings. The following is a general explanation telling the reason.
Assume there are n factors (X1, X2, X3, X4, ...,Xn) to compare, and each importance is represented by its name. The rating in a pairwise comparison matrix is to divide the degree of importance of the row factor by that of the column factor. Then, we have the following matrix:
|
|
X1 |
X2 |
X3 |
X4 | ... |
Xn-1 |
Xn |
|
X1 |
1 |
X1/X2 |
X1/X3 | X1/X4 | ... |
X1/Xn-1 |
X1/Xn |
|
X2 |
X2/X1 |
1 |
X2/X3 | X2/X4 | ... |
X2/Xn-1 |
X2/Xn |
|
X3 |
X3/X1 |
X3/X2 | 1 | X3/X4 | ... |
X3/Xn-1 |
X3/Xn |
|
X4 |
X4/X1 |
X4/X2 |
X4/X3 | 1 | ... |
X4/Xn-1 |
X4/Xn |
| ... | ... | ... | ... | ... | ... | ... | ... |
| Xn-1 | Xn-1/X1 | Xn-1/X2 | Xn-1/X3 | Xn-1/X4 | ... | 1 | Xn-1/Xn |
|
Xn |
Xn/X1 |
Xn/X2 |
Xn/X3 | Xn/X4 | ... |
Xn/Xn-1 |
1 |
Now, in the last row, let Xn/X1=Y1, Xn/X2=Y2, Xn/X3=Y3, Xn/X4=Y4,...,Xn/Xn-1=Yn-1, then X1=Xn/Y1, X2=Xn/Y2, X3=Xn/Y3, X4=Xn/Y4,...,Xn-1=Xn/Yn-1, and we have the following matrix:
|
|
X1 |
X2 |
X3 |
X4 |
... |
Xn-1 |
Xn |
|
X1 |
1 |
Y2/Y1 |
Y3/Y1 | Y4/Y1 |
... |
Yn-1/Y1 |
1/Y1 |
|
X2 |
Y1/Y2 |
1 |
Y3/Y2 | Y4/Y2 |
... |
Yn-1/Y2 |
1/Y2 |
|
X3 |
Y1/Y3 |
Y2/Y3 | 1 | Y4/Y3 |
... |
Yn-1/Y3 |
1/Y3 |
|
X4 |
Y1/Y4 |
Y2/Y4 |
Y3/Y4 | 1 |
... |
Yn-1/Y4 |
1/Y4 |
| ... | ... | ... | ... | ... | ... | ... | ... |
| Xn-1 | Y1/Yn-1 | Y2/Yn-1 | Y3/Yn-1 | Y4/Yn-1 | ... | 1 | 1/Yn-1 |
|
Xn |
Y1 |
Y2 |
Y3 | Y4 |
... |
Yn-1 |
1 |
The matrix above shows if the the ratings of the bottom row are set, the rest of the ratings, except the diagonal ratings, are also set because they are the function of the bottom row ratings. It is also true if users first set the ratings of any row or column, they have already defined the whole matrix and the weight factors.
This is the reason why consistency ratio is so important to indicate how feasible the weight factors are, and the users are not freely to assign ratings.