ginseng
The Most Suitable Location to Grow Ginseng
 
in Southern British Columbia
ginseng
Home
Conceptual Outline
Data Collection
Methodology
Spatial Analysis
Conclusion
Problems
   Data Collection


The data used for this project has come from a wide range of sources.  The digital elevation model (DEM) of British Columbia was obtained from the S: drive.  Rob Fiedler obtained a landcover shapefile which was put on the S: drive. The temperature and precipitation data was obtained from the Environment Canada website: www.climate.weatheroffice.ec.gc.ca

Most of my theoretical information came from:

  -Nadeau, I., Yelle, S., and Olivier, A., 1998. Growing American ginseng in maple forests as an alternative landuse system in Quebec,   
  Canada. Agroforestry Systems. 44: no 2-3 p.345-353
   -Archibold, O.W., Kort, J., Paterson, A., Ripley, E.A. 1998. Winter mortality risk for American ginseng (Panax quinquefolium) in
   Saskatchewan.  Applied Geography. 18: no 4 p.375-395
   - Interview with Dr. Bailey on November 9, 2004


   Data Manipulation


Digital Elevation Model
The DEM of British Columbia was in raster form on the S: drive.  The difficulty with using this data was that the projection was different from my other data and this map covered all of British Columbia, where I am looking at just the southern region of British Columbia. Firstly, to change the projection of the image the tool in IDRISI used was PROJECT.  As IDRISI does not have the same selection of projections available as ArcGIS a defined projection was created by Rob Fiedler to be used in IDRISI.  This enabled a new projection to be used for the image which was Canadian Lambert.

Landcover
The landcover data was available in shapefile format for all of British Columbia  This was opened in ArcGIS 9.0 for manipulation.  A layer was created that covered just the southern area of British Columbia that was used to clip the landcover data.  The shapefile was already projected correctly but had to be clipped.  The clipped landcover shapefile was now added to IDRISI.  This layer was in vector file format and had to be converted into raster.  The RASTERVECTOR tool under reformat was used to convert vector to raster.  As IDRISI only recognizes the ID values in ArcGIS as the polygon values, the values for the landcover must be assigned to the appropriate ID numbers.  This requires the database file in ArcGIS to be exported and opened in Excel.  In Excel all the unwanted fields can be deleted and the ID numbers with there appropriate landcover values can be saved as a comma separated file and opened in notepad.  Notepad can replace all the comma's with spaces and therefore save the file in a format which can be opened in the edit in IDRISI.  The edit file can be saved as an .avl file which can be used in the ASSIGN tool.  This process was required because there was over 9,000 polygons to assign a landcover value too.  This processed created an image with all the landcover information. 

Temperature and Precipitation
All temperature and precipitation values for stations in southern British Columbia were used from the Environment Canada website.  The data used was monthly averages from 1971 to 2000.  Only stations that meet the United Nation's World Meteorological Organization standards are used..  This gave the best general information on each station and allowed a decision based on the trend in climate for each area.  As ginseng can not have temperatures which go below -4 C, I recorded the lowest average value which occurred (usually occurred in January or December).  This information will be used to eliminate areas with really low winter temperature that would damage the ginseng if grown in that region.  As for the precipitation values, ginseng prefers relatively dry soil because moist soil provides a good environment for diseases and mold to form.  This can have a devastating effect on the ginseng and cause most of it to die.  For the monthly average values I recorded the maximum amount of precipitation that fell.  This allowed the regions with large amounts of precipitation to be given low suitability values in my analysis.  All temperature and precipitation values were recorded in Excel along with the latitude and longitude in decimal degrees.   This Excel file was saved as a database file and opened in ArcGIS 9.0.  Using the add x y data tool, the station points were displayed in ArcGIS and saved a shapefile.  This was opened in IDRISI in vector file format.  As the same problem with the landcover data, the ID values were displayed in IDRISI and not the temperature or precipitation values.  As done above avl file were creates and assigned to the data.  The data was in point vector data and needed to be converted into raster format.  This was done in the GIS Analysis,  INTERPOL tool.   This created interpolation images of maximum precipitation and minimum temperatures which can be used for my analysis.


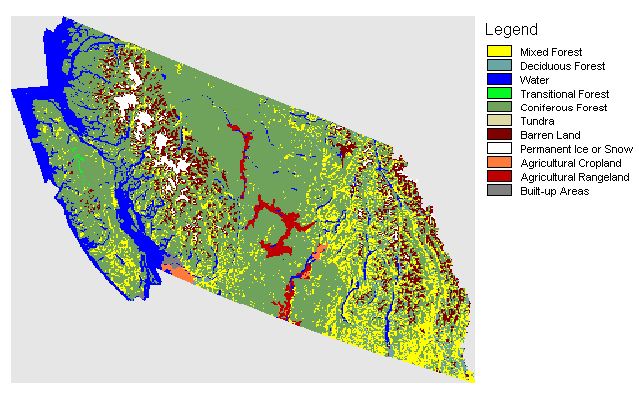
This is the landcover image created in IDRISI.  This was the starting point for my creating my landcover fuzzy maps in both the commercial view and traditional view.  There are 10 landcover types and water. 
landcover


temp
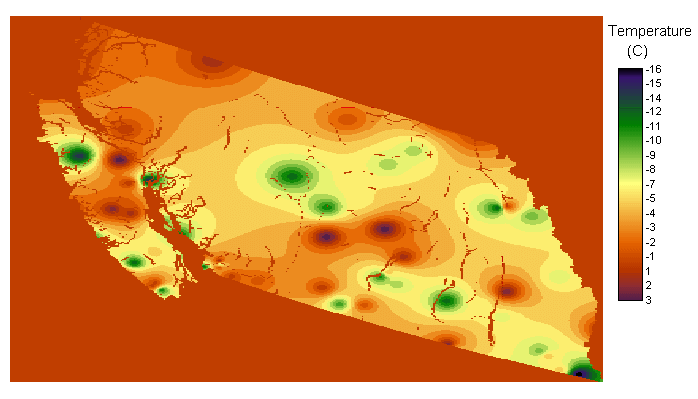
This was the starting point image for the temperature fuzzy images in both the commercial and traditional view points.  It represents the minimum average temperature values found in each area.  It has been created in IDRISI through interpolation.


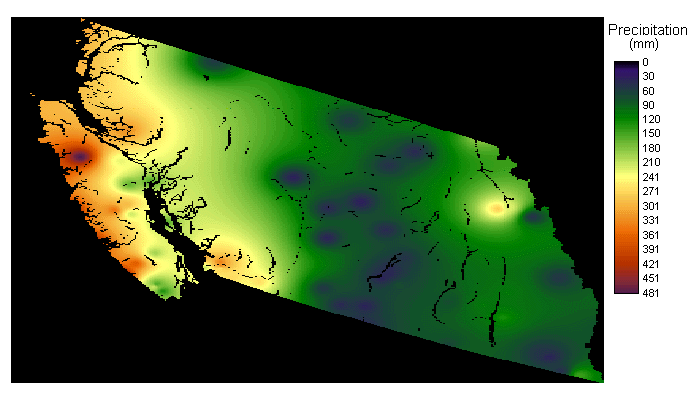
This was the starting point image for the precipitation fuzzy images in both the commercial and traditional  points-of-view.  It represents the maximum average precipitation values found in each area.  It has been created in IDRISI through interpolation. precipitation


Previous
Next