

Methodology
A
flow chart may be used as an aid in order to illustrate the following
processes
of the site selection analysis:

Preparation Step:
From the census data tables that I aquire it is determined
that the most useful one in our analysis
included
the information of population density and average household income in
2001, therefore, preparation processes
include
joining census data tables to the
Query:
Queries
offer a method of data retrieval, and can be
performed on data that are part of GIS database, or on new data
produced as a
result of data analysis. Two types of queries I have used for this
analysis:
spatial and aspatial.
Aspatial queries are questions
about the attributes
of
features. For example, ‘how many topographic coverage areas are over
118801 populations?’ on map 1
is an aspatial query neither the question nor the answer involves
analysis of
the spatial component of data.
Spatial queries are the question
or the answer
requires information about “where”. For example, where are the existing
competition locations? Furthermore, in this project, queries are made
more
complex by combination with questions about distances, areas and
perimeters.
For example, I have asked “where are the regions contain high average
household
income with high population density in labour force?" on map 10.
Boolean operators are often used to
combine
queries to identify entities in a database that satisfy two or more
spatial and
aspatial criteria. In GIS, Boolean expressions are AND, OR,
NOT and
XOR. In this analysis, I have asked these following Boolean operator
questions:
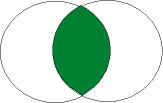
A And B (intersect)
 Which the regions are in
the category “potential sites”
and regions which are within 100 meters distance
of major
roads and
highways?
A OR B (union)

Which
the regions are in
the categories
of vegetation
and park & recreation?
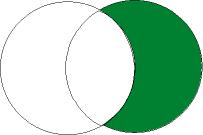
A NOT B

Which regions are in the
category
open area but do not have vegetation cover?
Buffering:
Besides queries, buffering
functions that are used in
this project allow a spatial entity to influence the character of an
entity.
Buffering is the common method to create a zone of interest around an
entity.
The question “which
potential areas are within 1000
meters buffer zone of the existing competition stores?” is being asked
for the
map 11. However, the first step of this approach is to produce a buffer
zone
identify all land up to 1000 meters from seven existing competition
stores. A circular five rings buffer zone
is produced and
each ring indicates 200 meters buffer distance. The second step is to
find out
which potential areas fall within the buffer zone. In addition, the
suggested
locations of the new MEC retail store are based on the catchment
concept that
its buffer zone must not be overlapped on other competitions’ buffer
zone.
The fundamental concept of the query for landuse is to separate potential and non-potential areas based on figure 3.

Figure3
Non-potential areas include the landuse categories of Government & Institutional, Industrial & Resource,
Park & Recreation, and Vegetation. A union of vegetation, park and
recreation is performed becasue
they have the same function. In addition, existing commercial areas are
counted as non-potential site because the land price is relatively high
that will increase the fixed cost. Finally, a union of open areas and residential areas is performed in
order to create
a new
potential layer that is more useful in my
analysis.
In order to
refine the potential area, a query is performed to select potential
areas
only outside 100 meters of selected BC railway (Map 6). Also, another
query is preformed in order to select potential areas within 100 metres
of major roads and highways (Map7). The main reason
is that major roads and highways link
to the rest of B.C. in all
directions, therefore a location that is visible from those roads and
highways is
crucial,
as many MEC members are from outlying areas.
In addition to land use, major
roads and highways, and the competition layer, dissemination areas are
added
along with the census data that have been previously joined (average
household and total
population
density in the labour force). A query for high average household income
is made, resulting in the new layer. This is followed by
an
intersection of the potential site selection layer and the high
population
density in the labour force layer, creating a high-density household
income
layer.
It is necessary to perform another intersect of this new
layer
with the 1000 meters buffer of competition so that selected polygons
within the
buffer are excluded. The result of the buffer further
refines the
potential sites
by
excluding areas too close to competition locations. As well, another 1000 meters buffer distance from the existing competition buffer is added in order to
avoid the overlap of the new MEC store's 1000 buffer distance. The final layer is titled Ideal
Locations for New Store, as it is the result of the queries, selections
and
analysis of the previous maps.
For the final map I need to
decide on a location for the new MEC store from the 8 remaining
ideal
locations based on a visual inspection analysis. The first criteria I
use is to
eliminate one of the possible sites included any areas that are
surrounded by
low population density in the labour force. This subsequently
eliminates the ideal polygons at the intersection of Rutland Road and
Highway 33 W.
The second criteria that I consider included areas
with close
proximity to commercial polygons. Therefore the store will remain
located in a region where local population normally purchase
their products at these areas.
After the visual inspection of Map 11, the final condition consists of
an
individual area that has an ideal physical size allowing MEC to choose
an exact
location within the specified area. If
this area is not preferred by MEC, the adjacent smaller polygon will
also be
suitable based on the above criteria. The suggested location of the new
store
is represented on Map 12 with a star and has a buffer of 500 metres
that
indicates the parameters described above with reference to competitors.
_____________________________________________________________________________________________________________________________
Site Design by Benjamin Lee, Department of Geography
Simon Fraser University
8888 University Drive
Burnaby, B.C.
Canada. V5A 1S6
