This project went fairly smoothly, but there are several problems and sources of error that need to be mentioned.
The first problems, all be it very obvious, was finding data to use. I orginally wanted to stay away from using the "canned data" on the SIS drive, and I acquired topographic data from the City of Coquitlam. This data looked beautiful on paper, but the detail level that it was done at was probably overkill for this kind of problem. In addition, my attempts to convert the data resulted in about two hundred individual vector layers being extracted from each quadrant of data. I now have personal experience with that statement "90% of any GIS project is preparing the data. After determining that the data I had really wasn't useful for my project because there were too few commercial zones on it, I decided to go with the GVRD data on the SIS drive. This greatly reduced the possibility for error created by myself splicing and joining all those nasty vector layers together.
With respect to spatial resolution, the data that I used probably wasn't the best resolution. Ideally, I should have had coverages with half the scale AND that contained individual zones and zone types. In commercial zones, only three commercial zones actually would allow retail sales of the nature of our store: CS-2, C2 and C4. Road type, width, traffic volumes and parking restrictions would have also played an important part in deciding where to put this store. I could have done this, unfortunately, I thought of it too late to gather data and very little local data of this nature is available on the web at this time.
There was another minor issue with the GVRD tabular data: The population and Income data were from different years. I decided to declare that the income data, from 1996, didn't change all that much over the four years to 1999, when the population statistics are from.
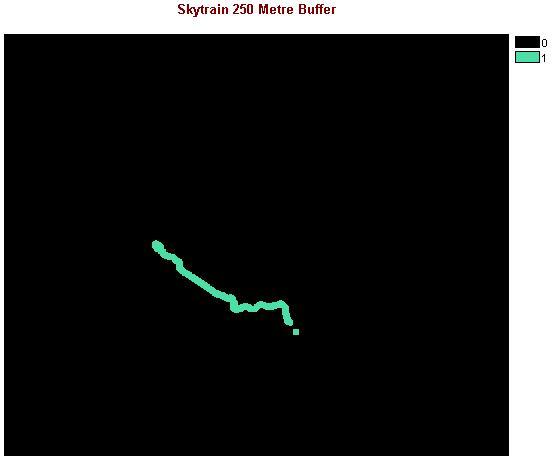
In terms of the Skytrain, with the addition of the Millenium line, and hopefully more lines in the not-to-distant future, there is a great deal of area that I didn't include in this analysis. Digitizing the new line onto the map would prove to be tricky because my skytrain buffer is only 250 metres in each direction, and digitizing error would drastically affect the final results. Another problem that occured was with the skytrain boolean layer. If you look at the boolean skytrain map, you notice that a section of the line seems to be missing. This arose from the rasterization of the skytrain vector layer and the area not covered by the skytrain buffer may have contained a suitable location.
There certainly was some error in my digitization of the Wal-Mart locations. With respect to the resolution of the raster images being used, it is impossible to accurately digitize the points of the four stores. The difference that a few hundred metres in location of the store would affect the area covered by the buffer, thus I may have removed locations that are perfectly fine by using an imperfect buffer zone. Conversly, I may have depicted an area as ok, but it may still be within 5km of a Wal-Mart. In addition to Wal-Mart, I could have considered Costco locations as well, but due to the fact Costco requires a membership, I did not consider them as big a threat to business as Wal-Mart.
In terms of the population density component of my project: there is a major shortcoming. Vancouver is becoming a post-modern city in which several distinguishable town centres exist rather than one central "downtown." My analysis did not implicitly account for the presence of these dense town centres located throughout the lower mainland. My major flaw was I calculated population density as a total population of a municipality divided by its area. This incorrectly assumed even population distribution, when in truth, population distribution is never even.
Lastly, I must comment on the nature of Idrisi as a cartographic display entity: Its terrible! The colours that they have chosen in their default palettes are awful, and the ability to make makes is nothing short of dispicible. Of course, the common response to comments like mine is "Its designed for analysis, not looks." To that, I say that GIS software needs to have a better graphics package built in for producing decent final analytical maps. I have recently made this suggestion to a GIS software developer.
PREVIOUS TABLE OF CONTENTS NEXT
Zoning information obtained from the City of Coquitlam Planning Department