The Analysis
The
analysis: the fun part! My analysis, as mentioned earlier, consists
mainly of creating a series of boolean maps and producing two maps using
Multi-Criterion Evaluation. The final maps that I will produce from
this will be maps depicting areas where it is suitable to place the store,
one taking the Skytrain into consideration and one that ignores it.
Running the MCE is the easy part: creating the various boolean maps requires
a series of data manipulation, value reclassing and assigning, buffer or
distance operations if required, and final layer creation using reclass
or assign.
The
Major Roads Factor
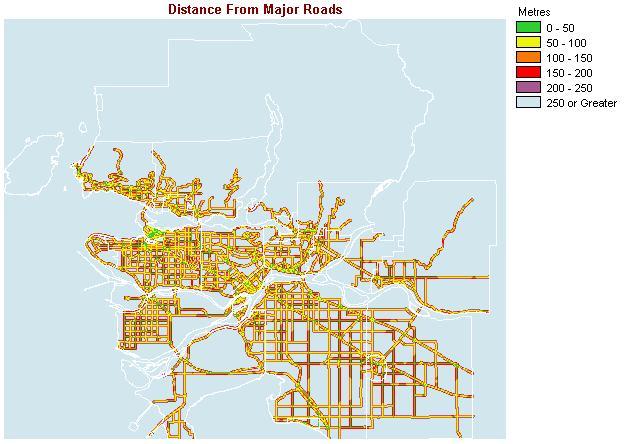
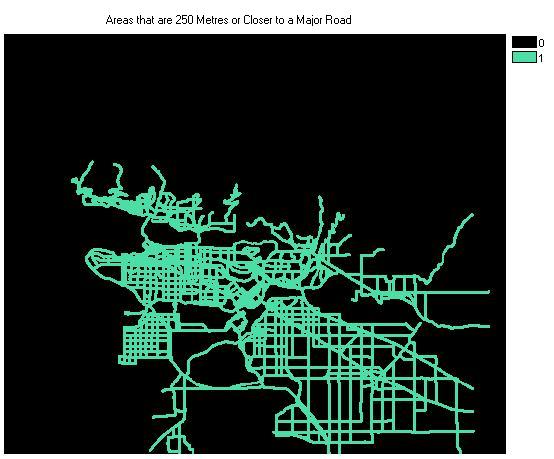
The first map that I created was a map showing distances
from major roads. I decided to make a map showing distances in equal
interval classes of 50 metres, and then a boolean map to use in the MCE
with areas less than 250 metres from a road classed as 1 and all other
areas classed as 0. I then added the city vector layer so that at
least some figure-ground relationship would exist. Its hard to tell
where the water is on this map, but the main purpose of showing distances
from roads is achieved.
To see the roads boolean map I used for analysis, click
here
The Zoning
Factor
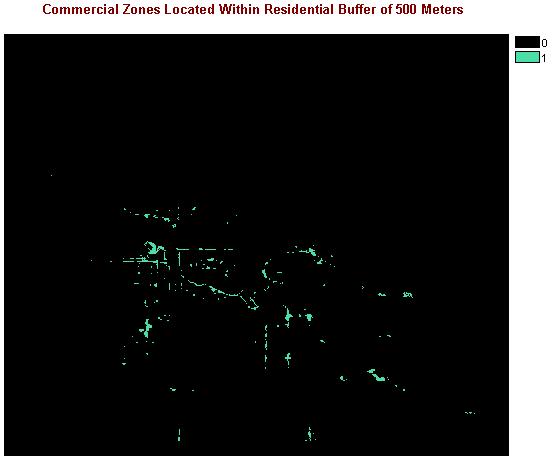
The next map that I produced is a boolean image resulting
from an overlay of two boolean images. Using the landuse raster coverage,
I first created a boolean map showing commercial zones. Then I used ASSIGN
to create a map showing medium and high density residential zones.
I then buffered these residental zones, setting the buffer zone and target
to 1 and the outlying areas to 0. This map is a result from multiplying
the first map by the second.
The Income
Factor
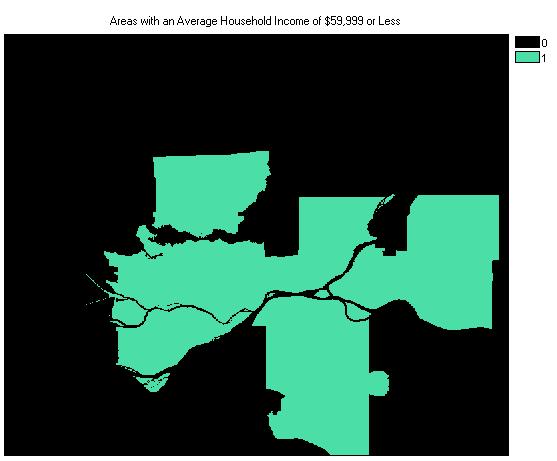
 When
it comes to saving money, everyone is in on it. Although generally
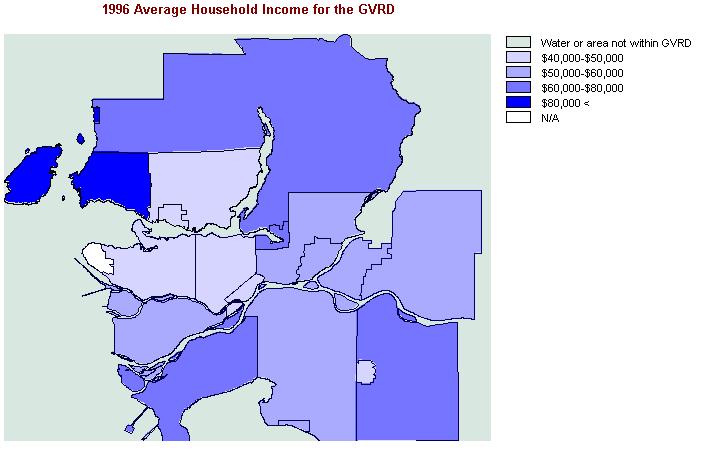
you would want to set up a store in areas of higher incomes, I have decided
to make one of the criteria in my analysis that the area's average income
be $60,000 or less. People with less income SHOULD be more interested
in saving money than people with a high income; therefore, they would visit
our discount retail outlet and hopefully spend some money!
When
it comes to saving money, everyone is in on it. Although generally
you would want to set up a store in areas of higher incomes, I have decided
to make one of the criteria in my analysis that the area's average income
be $60,000 or less. People with less income SHOULD be more interested
in saving money than people with a high income; therefore, they would visit
our discount retail outlet and hopefully spend some money!
For this analysis,
I needed some income figures for the GVRD. I found this in tabular
format at their website
and adding it to the CITY raster layer produced a rather nice choropleth
map. Although I was only interested in areas of medium and lower
income, I decided to show entire map as well to give you an idea of the
area. To see the boolean image, click here.
Population
Density
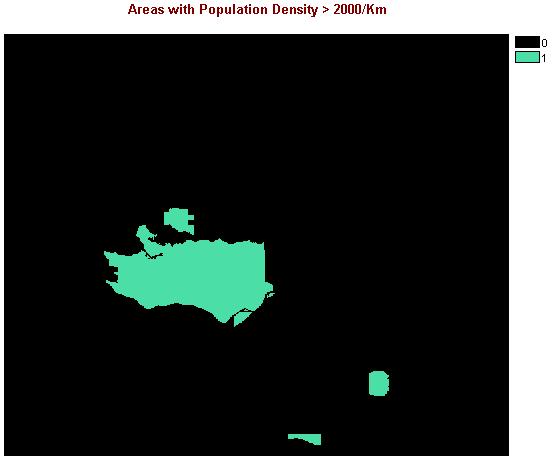
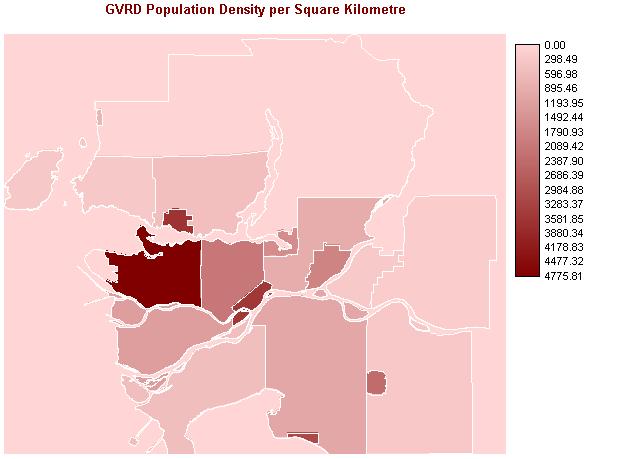 This
map was also produced from the landuse map in a similar way to the income
map. I got the information from the same website, and used ASSIGN
to assign individual population values to each enumeration area.
Then I used AREA to create a map from LANDUSE showing the area within each
of these areas. OVERLAY produced this choropleth, by dividing the
population map by the area map, shown here to the right. To take
population density into consideration in the MCE, I created a boolean image
that had areas with a density of 2000 people / square km or more to 1 and
areas with less to 0. To see the boolean image click here
This
map was also produced from the landuse map in a similar way to the income
map. I got the information from the same website, and used ASSIGN
to assign individual population values to each enumeration area.
Then I used AREA to create a map from LANDUSE showing the area within each
of these areas. OVERLAY produced this choropleth, by dividing the
population map by the area map, shown here to the right. To take
population density into consideration in the MCE, I created a boolean image
that had areas with a density of 2000 people / square km or more to 1 and
areas with less to 0. To see the boolean image click here
The Wal-Mart
Factor
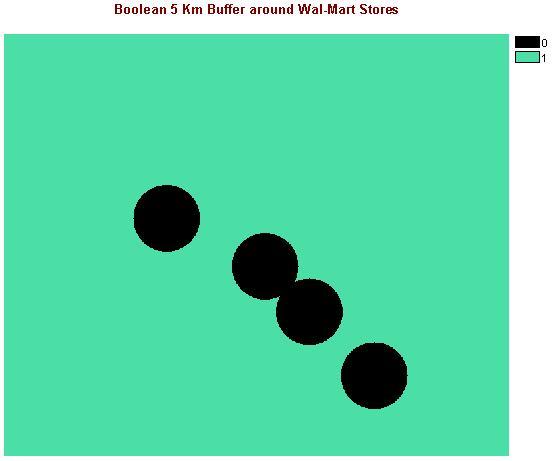
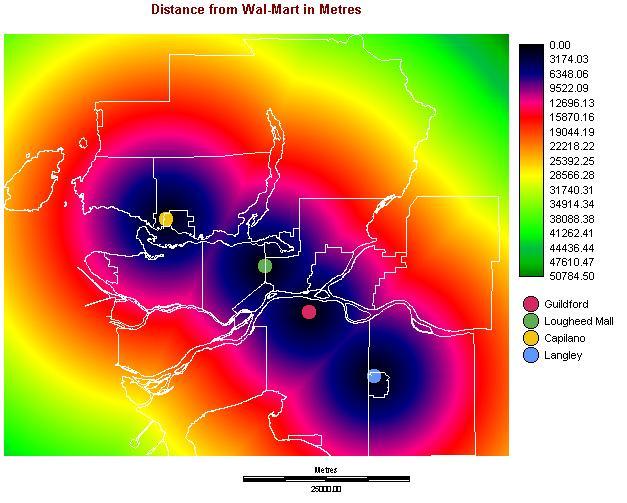 A
major factor in placing this store is the proximity to other discount retailers.
Although I could probably run an analysis on all the major chain discount
stores, I'd probably end up with them covering the entire map. To
prevent the entire GVRD from being declared unsuitable, I've decided only
to analyze Wal-Mart locations. In terms of spatial relationship,
I would either want to locate my store right beside a Wal-Mart so we can
mooch off of their customer base, or as far away as possible so they don't
draw our customers away from our store with their name, Wal-Mart.
A
major factor in placing this store is the proximity to other discount retailers.
Although I could probably run an analysis on all the major chain discount
stores, I'd probably end up with them covering the entire map. To
prevent the entire GVRD from being declared unsuitable, I've decided only
to analyze Wal-Mart locations. In terms of spatial relationship,
I would either want to locate my store right beside a Wal-Mart so we can
mooch off of their customer base, or as far away as possible so they don't
draw our customers away from our store with their name, Wal-Mart.
I've decided to find areas that are NOT influenced by
Wal-Mart. I incorporated this factor into the MCE by reclassing all
areas within 5000 metres as 0 for strong influence (not wanted), and all
areas further as 1 for weak influence. To see the boolean image, click
here.
The Skytrain
Option
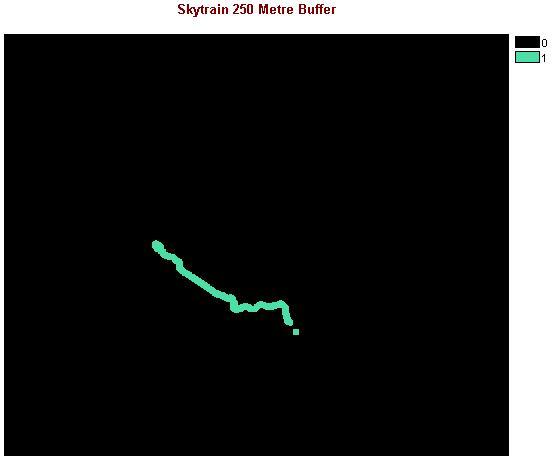 For
the last criterion in my project, I decided to make it an optional criterion.
There really wasn't much to creating this image: I Converted the vector
layer SKYTRAIN into a raster layer, then I created SKYBUF, a raster image
depicting a buffer of 250 metres around the skytrain line.
For
the last criterion in my project, I decided to make it an optional criterion.
There really wasn't much to creating this image: I Converted the vector
layer SKYTRAIN into a raster layer, then I created SKYBUF, a raster image
depicting a buffer of 250 metres around the skytrain line.
The Multi-Criterion
Evaluation
This part of the analysis involves mashing all of the
above created boolean images together and producing the final maps using
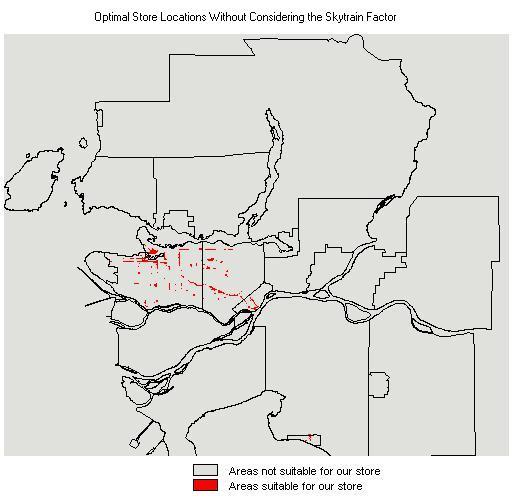
the MCE function. The first map produced shows all areas that are suitable
with respect to the skytrain. The second map greatly increases the
possibilites for a location, for I have removed the skytrain factor.
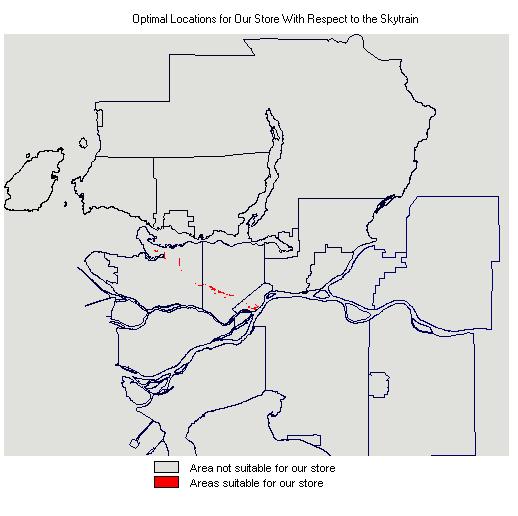
Note: A large-scale map of "Suitable Areas With Respect to the Skytrain"
is in the conclusion section
PREVIOUS TABLE
OF CONTENTS
NEXT