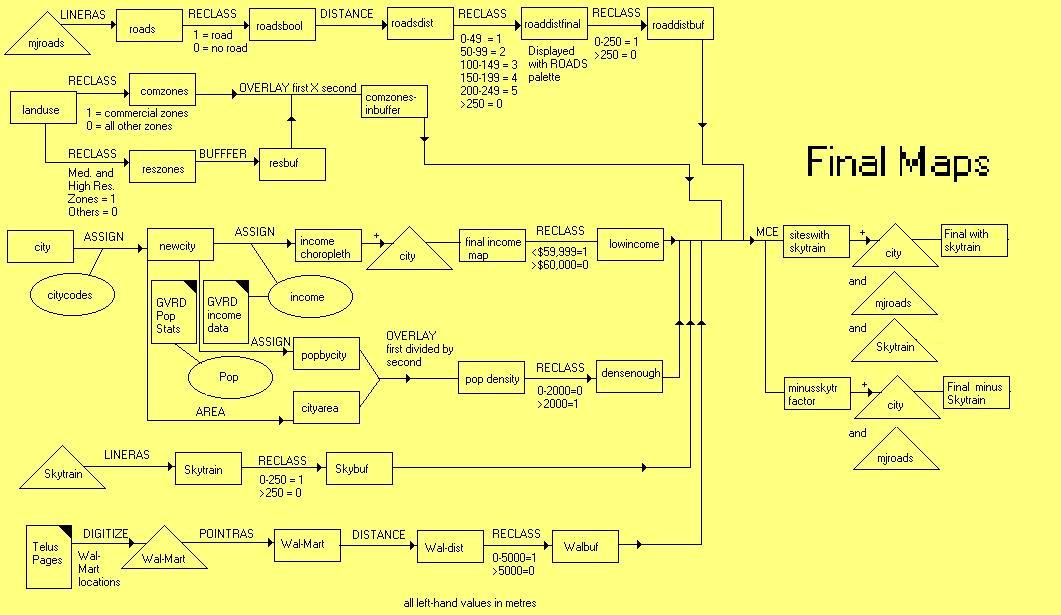
The cartographic model for this map turned out to be much more extensive than I originally thought. Creating the boolean maps required a long string of operations for each map. The methodology followed is of a typical nature for a multi-criterion evaluation. The steps to create each map are illustrated clearly, followed by their final combination to create the final maps.
The above model should be self explanatory. Several of the better looking maps are posted on the analysis page. Some of these maps include the Income choropleth and the Wal-Mart distance map.
Note: I am aware that cartographic models are normally drawn with the final map on the left; however, it felt more natural to draw it this way.
PREVIOUS TABLE OF CONTENTS NEXT
Zoning information obtained from the City of Coquitlam Planning Department