Multi-Criteria EvaluationMulti-Criteria Evaluation
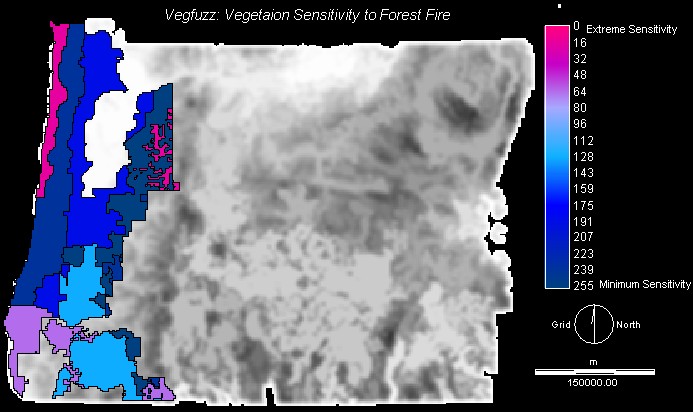
Importance of FactorsThe creation of a forest fire sensitivity spectrum landscape required a spatial analysis techinique that would indicate a continuity of susceptibility to experiencing fire rather than a simple Boolean technique that would differentiate the most sensitive areas from others not as sensitive. While Boolean analysis allows only the identification of areas as sensitive or not sensitive, the Weighted Linear Model facilitates discrimination of the importance of various factors used in the analysis. This is essential in the case of generating a fire sensitivity/susceptibility spectrum because certain criteria are more determining than others, and while some areas are less prone to experiencing forest fire than are others, they may still be highly susceptible.Factors: FUZZY Classification of CriteriaFactors that affect susceptibility to forest fire: Once I had converted all downloaded coverages into ASCII raster format in ArcView, I imported them into Idrisi and employed the FUZZY utility to reclassify the pixels along a spectrum from 0 - 255, with 0 representing the area outside the state perimeter (or background), and 255 representing areas characterized by the lowest susceptibility to forest fire incidence for each give factor. With the exception of Forest Fire Incidence, which indicated areas as either sensitive (had not experienced a forest fire = 0) and sensitive (had experienced burning 1980-1989 = 255) and thus represented a linear curve, all other criteria were scaled using a Sigmoidal curve because sensitivity would both peak and decrease at certain levels, and then gradually decline or increase from that level to maximum sensitivity and or tolerance.Constraints: Boolean AnalysisBecause the digital vegetation data covered only western portions of OregonThus, Vegbool was created as a constraint.
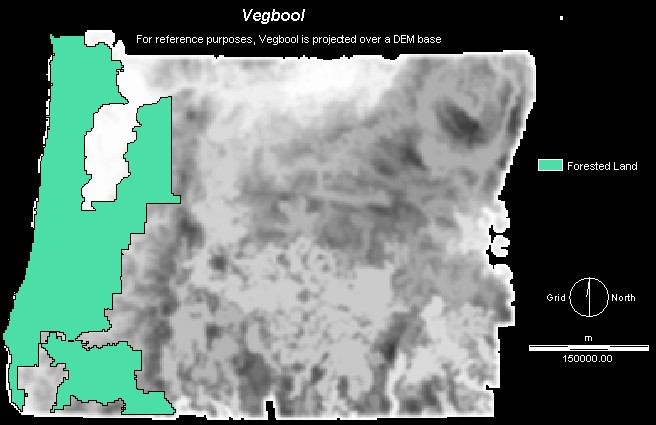
, the comprehensive forest fire sensitivity index must to be restriced to the vegetated areas as these are the only areas that have digital coverage of all factors affecting susceptibility. Thus, a Boolean image separating forested areas from non-forested areas was necessary in order for the evaluation to disregard areas beyond the forest perimeters. If non-forested areas were included, this would skew the analysis result because non-forested areas would be evaluated differently from forested lands because of the lacking presence of the extra factor, Vegfuzz, in those areas.
For DEM construction process, please follow link
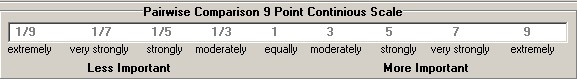
WEIGHT: Determining the Relative Importance of FactorsA pairwise comparison file was created, identifying the relative importance of factors in their determination of forest fire risk:
vegfuzz junefuzz augfuzz julyfuzz aspectfuzz slopefuzz firefuzz vegfuzz 1 junefuzz 3 1 augfuzz 3 1 1 julyfuzz 3 2 2 1 aspectfuzz 4 3 3 3 1 slopefuzz 1/2 1/4 1/4 1/4 1/3 1 firefuzz 1/5 1/6 1/6 1/6 1/9 1/7 1
The following weights were calculated for each factor, based on the above matrix:Calculated Weigths
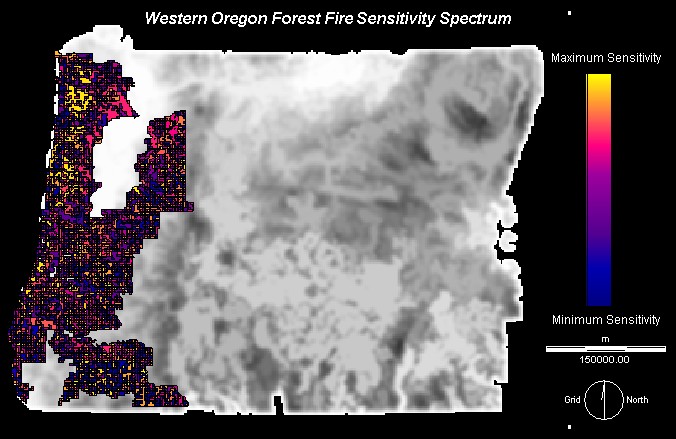
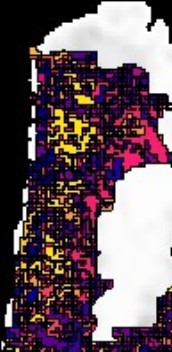
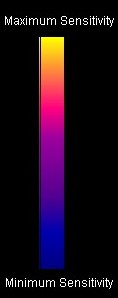
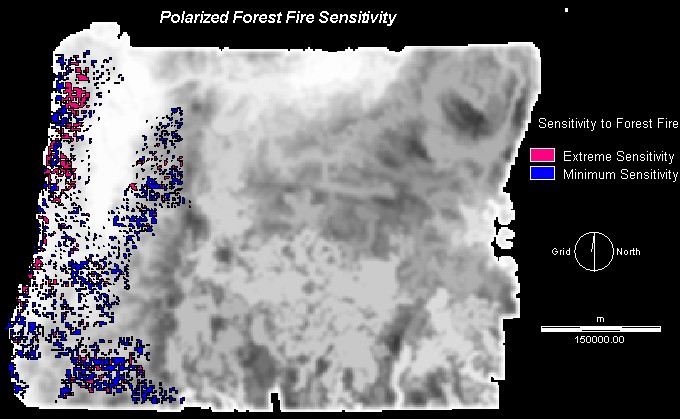
vegfuzz 0.0751 junefuzz 0.1497 augfuzz 0.1479 julyfuzz 0.2026 aspectfuzz 0.3354 slopefuzz 0.0655 firefuzz 0.0221 Using the weighted factors and Vegbool as a constraint, a continuum of sensitivity to experiencing forest fire is derived for the forested areas of western Oregon:
This analysis indicates the the sensitivity to fire of various forested areas of western Oregon relative to each other; however, the combination of all the possible states of these factors and their various influences has resulted in the generation of few homogenous polygons. For example, slope is one factor, yet depending on the slope range, various risk weights/ratings are allotted to a particular gradient. This illusrates how orignal criteria easily propagate, complicating the analysis. The importance, however, is the identification of several homogenous zones of high sensitivity in northwest coastal oregon forests, easily visible under enlargement.For DEM construction process, please follow link
Western Oregon Forest Fire SensitivityFurthermore, this analysis only serves to indicate which areas are more sensitivte to experiencing a forest fire than are others; this in by no means an indication of actual forest fire risk that accounts for current temporal-spatial environmental conditions such as two weeks of coincident record high temperaturs, drought, and strong winds that may actually induce a forest fire.
It is also possible to isolate the extremely sensitive areas from the least sensitive areas:
For DEM construction process, please follow link

Agnieszka Leszczynski
2001
Geography 355
Simon Fraser University