VegetationFactors (click on the link):
Vegetation
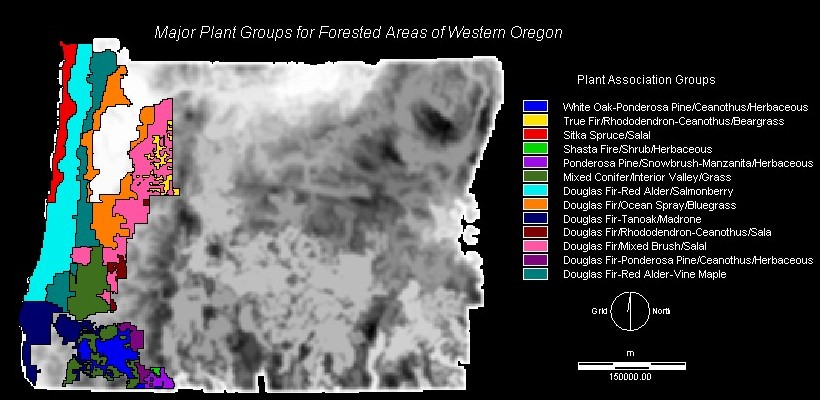
 The vegetation coverage I selected to use in this project came in the form of "Major Plant Groupings," which classified areas of western Oregon into generalized polygons of prevalent vegetation types identified by a dominant (and sub-dominant) tree species, shrubbery and fuel soure. Fuels are both organic and inorganic materials such as grasses and fallen trees, that combust easily and are the main ignition source.
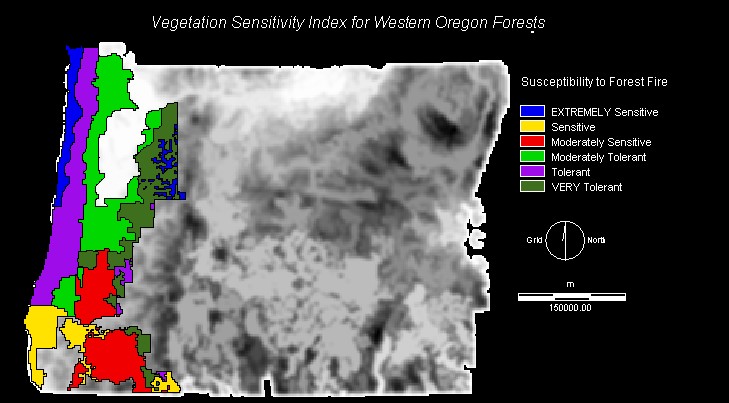
I subsequently reclassified vegetation groupings along a fire sensitivity scale from 1 through 6, with 1 being the most sensitive to burning, transmitting/conducting fire, and sustaining damage from open and subsurface flame once ignited. My classification scheme is based on species-specific fire ecology information derived from the US federal Fire Effects Information System (FEISVegetation Sensitivity Index
skipthis
Major Plant Association Group Sensitivity Rating Explanation True Fire/Ceanothus/Beargrass 1 TRUE FIR: Oregon has 6 species, some of which are EXTREMELY fire sensitive, particularly Grand Fir, which has highly flammable foliage, and Pacific Silver Fir, which is killed by almost any fire.
BEARGRASS, the fuel source, transmits forest fire quickly and burns easily if it doen not receive adequate precipitation.Sitka Spruce/Salal 1 SITKA SPRUCE has a very shallow root system, and a very thin bark that makes it very susceptible to fire damage.
SALAL comprises a fire tolerant fuel bed in the sense that fire induces species propagation, but it burns very easily.Ponderosa Pine/Snowhbrush/Herbaceous 2 PONDEROSA PINE is a fire resistant species because of its specific physiological adaptations to fire, such as an open crown structure, thick bark, and deep root system. HOWEVER SNOWBRUSH is an extremeley flammable fuel source.Douglas Fir-Tanoak/Madrone 2 DOUGLAS FIR is more fire resistant that any of its associated species, and it can survive severe fires because of its deep root system, foliage concentration on upper coles, and a very thick bark which protects the inner cambium from flame and heat damage. HOWEVER TANOAK is a fire senstive species because its thin bark offers little protection and its aerial portions are often killed by surface flame.White Oak-Ponderosa Pine/Ceanothus 3 WHITE OAK is a fire tolerant species, rough scaly bark makes it moderately resistant to ignition
PONDEROSA PINE is a fire resistant species, with specific physiological adaptations to fire, such as deep roots, a thick bark, open crown structure, and a smooth bole which reduces aerial fire spread.Mixed Conifer/Interior Valley/Grass 3 Because this category is somewhat vague and gives little indication of species type, I acribed it a moderate sensitivity value. Douglas Fir-Red Alder-Vine Maple 4 DOUGLAS FIR is a very fire resistant and tolerant species. It's thick bark protects the living parts of the tree from damage, and the concentration of foliage on upper boles reduces the risk of the tree catching on fire, as well as aerial fire spread.
RED ALDER has a thin bark, but if fire resistant enough to protect trees from light surface fires, its foliage is not a good transmitter of flame, and grows on moisture rich soils.
VINE MAPLE is well adapted to fire, but severe fires crown-kill trees.Douglas Fir/Ocean Spray/Bluegrass 4 DOUGLAS FIR's thick, tough bark and lack of lower-bole foliage make it a very fire resistant species.
BLUEGRASS, when it receives inadequate moisture, represents a flammable biomass that acts as a fuel source.Douglas Fir-Red Alder/Salmonberry 5 DOUGLAS FIR is both resistant to and tolerant of fire, able to survive even severe open flame because of its high crown and bark composition.
RED ALDER does not transmit fire very well, and has a bark that is fire resistant enough to protect trees from light-moderate surface fires.Shasta Fir/Herbaceous 5 SHASTA FIR can tolerate occasional fires. It's bark is thick and fire resistant, and needles and branch tips are physiologically adapted to resist fire and heat damage. It grows in relatively open stands in terrain with many natural breaks, reducing the rate of fire spread. Furthermore, there is often low surface fuel accumulation on Shasta Fir stand ground, which also slows down the speed at which any potential fire would travel. Douglas Fir/Mixed Brush/Salal 5 DOUGLAS FIR's thick, tough bark and lack of lower-bole foliage make it a very fire resistant species.
SALAL comprises a fire tolerant fuel bed in the sense that fire induces species propagation, but it burns very easily.Douglas Fir/Ceanothus/Salal 6 This plant association group is a less fire sensitive group than the one above (D. Fir/Mixed Brush/Salal) because it has Ceanothus rather than mixed brush.
CEANOTHUS is the taxonomic term for shrubs, and shrubs tend to be less prone to drying out that short brush, that is near to the ground, and tends to have much shallower root systems.Douglas Fir-Ponderosa Pine/Ceanothus/
Herbaceous6 DOUGLAS FIR is a very fire resistant and tolerant species. It's thick bark protects the living parts of the tree from damage, and the concentration of foliage on upper boles reduces the risk of the tree catching on fire, as well as aerial fire spread.
PONDEROSA PINE is a fire resistant species, with specific physiological adaptations to fire, such as deep roots, a thick bark, open crown structure, and a smooth bole which reduces aerial fire spread.
The combination of the two most fire resistant dominant tree species make this major plant group the most fire resistant on the spectrum.
Accounting for the relative sensitivity of the major plant associations, it is possible to depict this sensitivity index, derived by reclassifying the original 13 categories, cartographically:
The two most importent topographic variables that influence the sensitivity of an area to forest fire are:SLOPE affects the rate at which a fire will spread rather than the susceptibility of that area to experiencing a forest fire. Fire propagates upslope with prevailing winds much faster than it would on level, or gentler, slopes. Therefore, the steeper the slope, the faster a fire can spread. According to McArthur (1973, link to documentSlope
ASPECT has a much more direct and potent topographic influence on forest fire risk than does slope. Aspect directly affects the amount of solar radiation received by a fuelbed, and thus influences fuel temperate, its rate of evapotranspiration and consequently its dryness, and therefore its susceptibility to catching on fire (Urban- Wildland Interface Fire: The I-Zone Series; Chapter VIII: Fire Behaviour Modelling, link to document
In the Northern Hemishphere, South facing slopes experience more forest fires than North facing slopes because Southerly slopes receive more direct sunlight (The Asian GIS Portal, link toThe USDA Forest Service for the Northern Region, which encompasses Oregon, has derived a matrix that describes the relationship between aspect and slope topographic relationships, and how possible combinations of aspect and slope risk factors affect the overall influence of topography on the fire sensitivity of an area.
>53% HIGH Risk
Because aspect is the critical factor and slopes acts as more of a multiplier, the risk matrix weights aspects heavier than slope:Topographic Risk Matrix
Aspect Risk (r) Value (r) Slope Risk
(s)Value(s) Topographic Risk Combined
Value
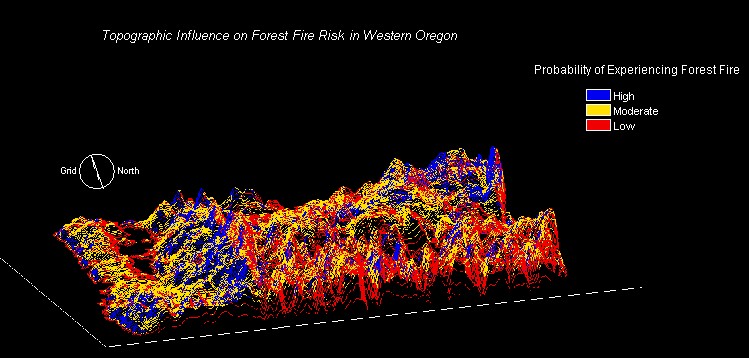
(r*s)High 1 High 1 High 1 High 1 Moderate 2 High 2 High 1 Low 3 Moderate 3 Moderate 2 High 1 High 2 Moderate 2 Moderate 2 Moderate 4 Moderate 2 Low 3 Low 6 Low 3 High 1 Moderate 3 Low 3 Moderate 2 Low 6 Low 3 Low 3 Low 9 I converted 50-foot interval contours for Oregon into ArcView shape file format using the FME conversion utility, and used ArvView's spatial analyst to convert the vecotr isolines into grid format. This DEM was them imported into Idrisi as an ASCII raster, and filtered using a mean filter to remove random noise. A Guassian filter was applied to the mean filtered DEM to close gaps in the perimeter of the origmial DEM because values of "0" that indicated flat land were recognized as having no value and thus belonging to the background of the image. By closing the perimeter, I was able to run the Pit Extraction utility (Idrisi 32) and fill in the majority of gaps that were present in the image (the former "0" values). From this, I used Idrisi's Surface Analysis to calculate slope (in percent) and aspect. I then reclassified slope and aspect individually, assigning values of 1 for high risk, 2 for moderate risk, and 3 for low risk. Once the slope and aspect risk images were created, I overlaid the two images, multiplying aspect by slope. Because I had already determined what the resulting values would be for each instance of multiplying slope by aspect, I could easily reclassify the composite image alloting the following product values to each risk category:
Once I had created a topographic risk image, I used the original filtered DEM as a surface image and draped the topographic risk image to create a 3-Dimensional (ORTHO) view of topographic probability for experiencing forest fire.
Historical Forest Fire Incidence
According to Rasmussen, M. and Ripple, W.J., the western Oregon Coast Range mountains have a natural fire cycle of 214 years (Historical Forest Fire Patterns in Western Oregon,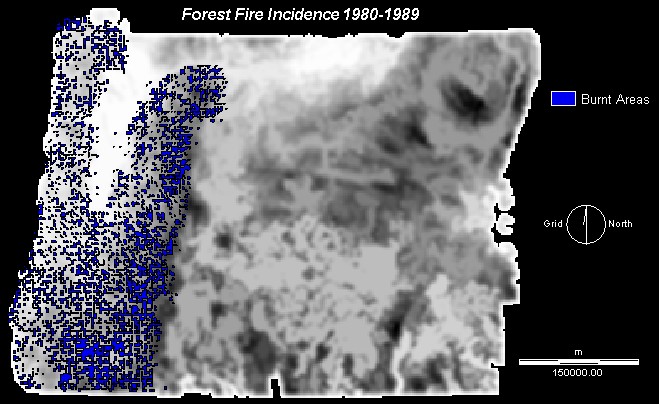
Vecotirzed burnt areas prohected overtop a filtered DEM: see method for calculating slope and aspect
Precipitation - Relative Drought Index
Summer moisture conditions, along with aspect, are one of the most direct influences on forest fire risk. As noted by Miller et al, Summer drought conditions indicate low plant moisture and consequently high flammability (Evaluating Risks and Benefits of Wildland Fire at Landscape ScalesSubsequently, I totalled the averages in the table and divided by 3 in order to establish a summertime mean precipitation of 1.113 inches. In ArcView, I edited the the attribute tables of all 3 thematic layers (June, July, August), adding a new field entitled "Drought," reclassifying the precipitation values into the following categories:To determine which areas in Western Oregon typically experience drought conditions, I obtained historical precipitation data from the Oregon Climate Service's reports
I divided the average that I derived for each zone by 3 in order to compensate for high averages in any one zone for any months that would have skewed the average for that month.Climate Zones 1, 2 and 3
Month Precipitation Average
(inches)June 1.6365 July 0.668591 August 1.034
Category Precipitation Range (inches) 1 0 - 0.99 2 1 - 1.99 3 2 - 2.99 4 3 - 3.99 5 4 - 4.99 6 5 - 5.99 7 6 - 6.99 8 7 - 7.99 I converted all three themes to grids, exported them in ASCII format, and imported them into Idrisi where I created Boolean images indicating susceptibility to drought (receiving less than the summertime mean). I overlaid three Boolean images to create a composite Boolean image that idicated areas that received less than 1.113 inches of precipitation during at least one of the summer months. These areas receiving less than the mean in either June, July or August are consequently susceptible to drought.
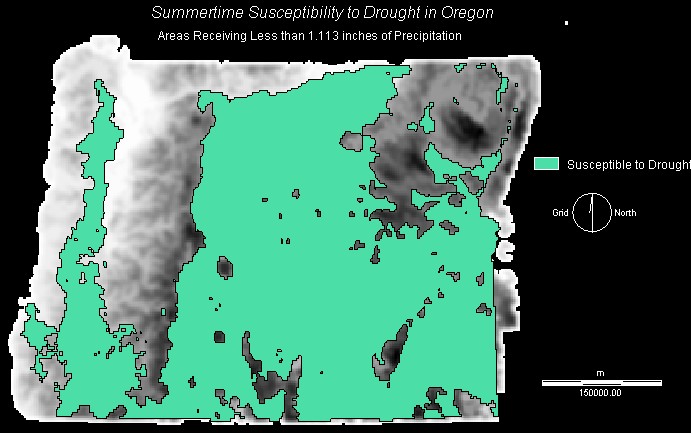
Vectorized Drought Index Boolean Image projected overtop a filtered DEM
Agnieszka Leszczynski
2001
Geography 355
Simon Fraser University