The first step of my project was to find data that
could be used for my purposes.
Knowing that I could not get data for the Lower Mainland, at least
not as comprehensive,
without purchasing it, I decided to use the existing data on the SIS
server. The layers that
I ended up using were: Landuse, Allroads, City,
and the DEM. From only four layers, along
with the data that I digitized, I was able to complete my entire analysis.
The next step for my analysis was to create the
data that I did not have. I did this by
digitizing it. I digitized all of the bus routes for the Maple
Ridge, Pitt Meadows, Port Coquitlam,
Coquitlam, and Port Moody areas. To do this, I used the Allroads
layer as a computer outline
and then used the Bus and Skytrain Timetable for the Port Moody to
Maple Ridge areas. I
digitized all of the roads serviced by bus routes instead of overlapping
many different busses.
Having all of the busses overlapping on the same roads would create
too much clutter as well as
the fact that it would not help in my analysis
I also digitized the exiting bus stations and the
forthcoming Lougheed Mall Skytrain station using
the same process as explained above. The only difference is that
these locations were points
whereas the bus routes were lines.
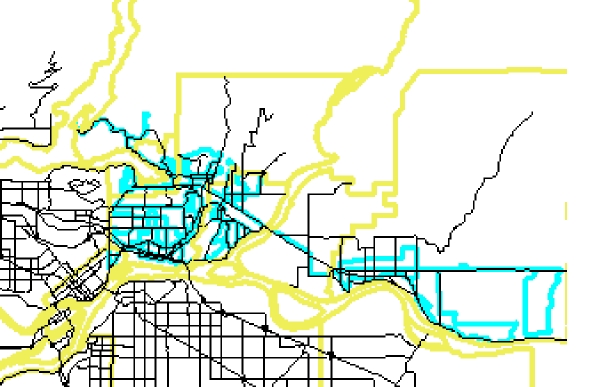
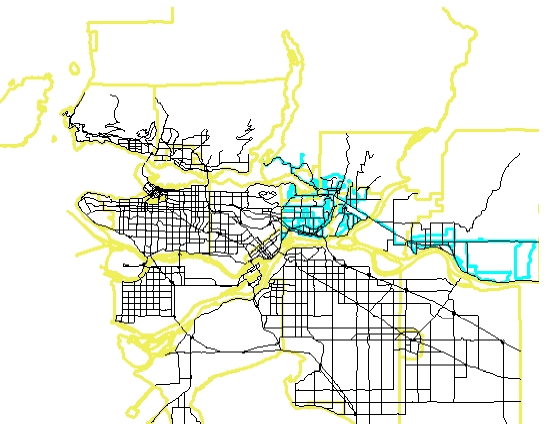
Digitized Bus Routes for Port Moody to Maple
Ridge
Close-up View of the Digitized Bus Routes
Next PageBack to Project Page
Back to INDEX