Multi-criteria Evaluation (MCE) requires criteria of two types, constraints and factors. Constraints are composed of Boolean images, which are hard decisions, limiting the analysis to a particular geographic region. Factors are criteria which define some degree of suitability for all geographic regions.
Part A:
Constraints:
Landuse - The site must be located in the City of Vancouver but outside the following landuse types:
- Lakes and waterbodies
- Recreation and Protected natural areas
- Transportation, Communication, and Utilities
- Industrial areas
Study Area - The site must be located within the City of Vancouver.
Factors:
Distance from landuse - The site must be further away from inappropriate landuse types.
Distance from road networks - The site should be located close to the road network so police officers are able to attend to emergencies
Distance from existing community policing centres - The site should be away from existing community policing centres to make their resources more widely available to those locations in need.
Distance from existing police stations - The site should be away from existing police stations to make their resources more widely available to those locations in need.
Total Crime rates - The site should be located in areas where there are higher rates of crime. Note: the total crime rates for each type of crime was used for MCE Result 1 (see Spatial Analysis).
Population Density - The site should be located in areas where there is a high population density, as more crime may occur in these areas. Population Density was calculated by dividing the population for each DA over the area. The total population density was then figured out for each neighbourhood.
Distance from boundary edges - The site should be located away from edges of the next municipality, this being the City of Burnaby and areas close to the 'Electoral A.'
Average Income - The site should be located in areas of lower income, as these areas are more socially unstable and as a result, more crime occurs in these areas.
Click here to see the cartographic model for methodology.
Part B:
Constraints:
Distance from Landuse - A raster layer was used (landuse0401.rst) after it was converted from a vector file. Numerical values was assigned to the corresponding types of landuse. Next, landuse values was used to assign new values in order to create a Boolean image (landuse0401_1.rst).
|
Landuse type
|
Landuse ID |
Assigned value
|
|
|
2
|
1
|
|
|
1
|
1
|
|
|
10
|
1
|
|
|
11
|
1
|
The areas that currently have the value 1 are assigned a value of zero because these areas will not be considered. A Boolean image (landuse0401_2.rst) was created.
Study area - The raster layer (gvrd1.rst) of the study area was converted into a Boolean image. It was converted to integer, then the assign function was utilized, creating a new raster layer (gvrd_.rst).
|
Municipality
|
Assigned Value
|
| City of Vancouver |
1
|
| City of Burnaby |
0
|
| Electoral A |
0
|
Factors:
Landuse - The cost distance function was used to create a cost distance layer (landdist.rst) from the raster layer, landuse0401_1.rst. Friction values from 1 to 1000 was assigned to the landuse. In appropriate landuse types were given high values, such as 1000 since they act as barriers, thus it would be best to avoid them at high cost. The FUZZY module was applied to the distance raster layer to create a new standardized layer, landfuzz.rst.
Distance from Road networks - The RECLASS module was used to give a value of "1" to the roads networks. Then a distance layer of the roads layer (roads.rst) was created from the Boolean image. Then the FUZZY module was used to create the new layer (rdsfuzz.rst).
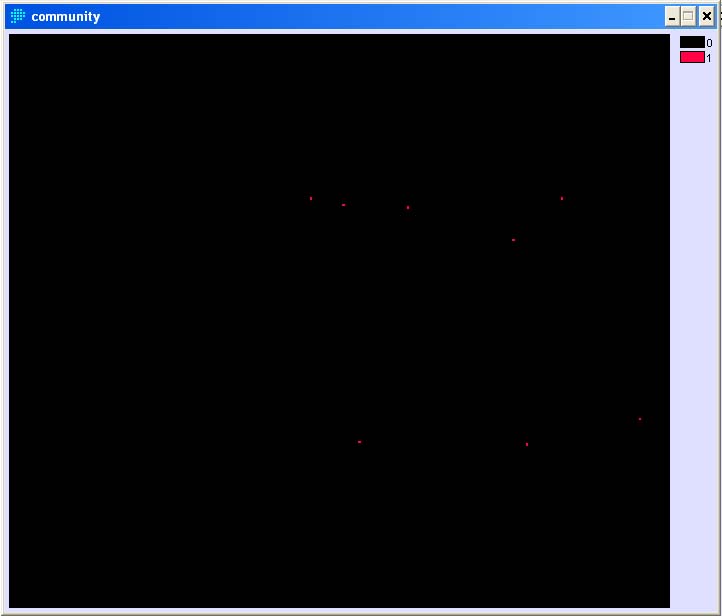
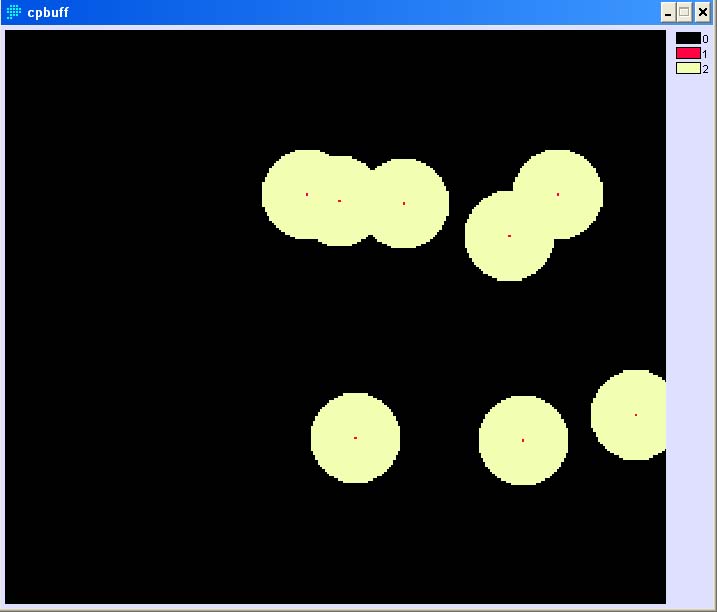
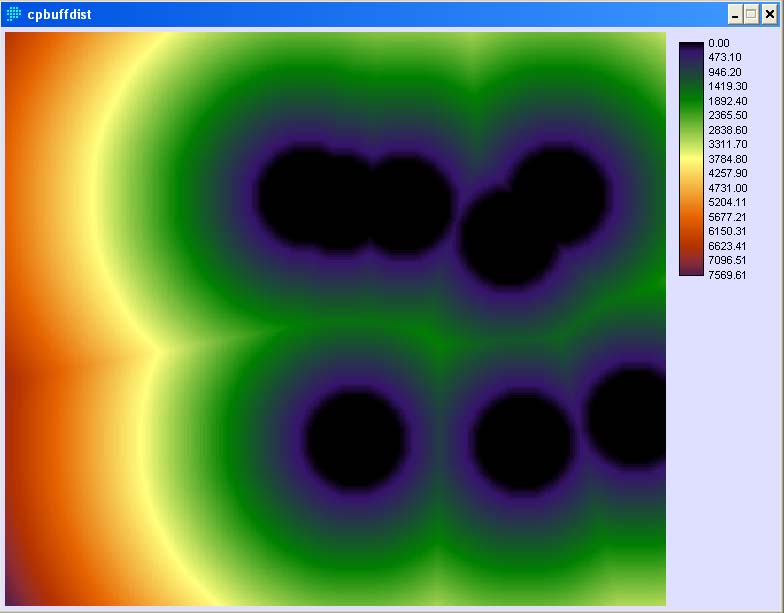
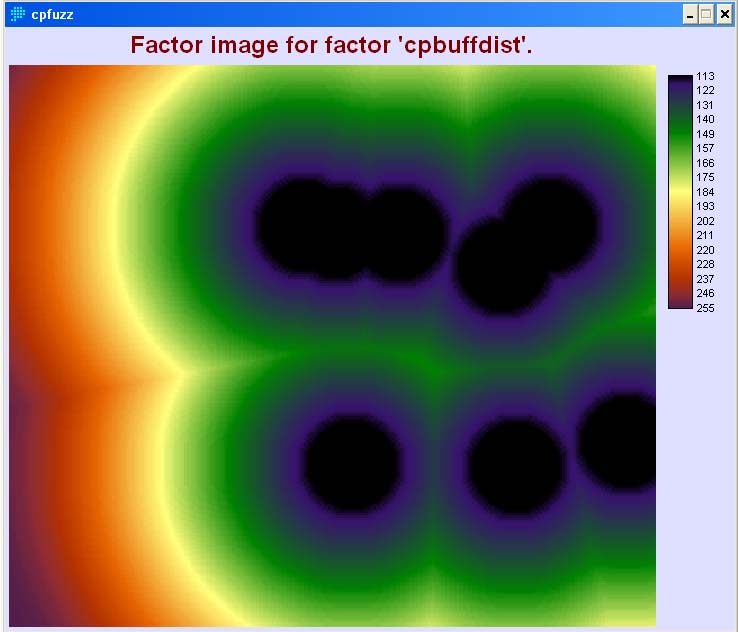
Distance from existing Community Policing centres - The RECLASS module was utilized to create a Boolean image (community.rst). Values "1" to "8" were given a new value of "1". The BUFFER module was applied to exclude areas within 1000 meters the community policing centre, thus preventing overlapping of existing resources. Next, the distance function was applied create a new raster image (cpbuffdist.rst) and the FUZZY module was applied to the distance layer.
Distance from existing Police Stations - The RECLASS module was applied to create a Boolean image (police.rst). Values "1" and "2" were given a new value of "1". The BUFFER module was applied to create a buffer of 2500 meters around each police station, thus the new police station would not be located within 2500 meters of the existing police stations. Next, the distance function was applied to create a new raster image (psbuffdist.rst) and the FUZZY module was applied to the distance layer.
Total Crime rates for each neighbourhood - The ASSIGN module was utilized to assign the corresponding crime rates to each neighbourhood, creating a new raster layer (totalcrime.rst). The FUZZY module was then applied to the raster layer, resulting in a standardized image (totalcrimefuzz.rst).
Population Density - The ASSIGN module was used to assign the corresponding population density for each neighbourhood. The FUZZY module was then applied to the raster layer which resulted in a new raster image (populationdenfuzz.rst).
Distance from boundary edges - New values were assigned to the raster layer, gvrd_.rst, to create a Boolean image so that the study area is given a new value of "0". The DISTANCE module was applied to the new raster image, gvrd_1.rst, to yield a new distance raster layer, gvrd_2.rst. The FUZZY module was then applied to gvrd_2.rst, which created a new raster layer (gvrd_2fuzz.rst).
Average Income - The ASSIGN module was utilized to assign the corresponding average household incomes to each neighbourhood, creating a new raster layer (incomeneigh.rst). The FUZZY module was then applied to the raster layer, resulting in a standardized image (incomeneighfuzz.rst).
Fuzzy Sets
Using the FUZZY module as described above, each factor was standardized to a byte-level range (0-255). The table below summarizes the standardization process for each factor.
|
Raster Factor File
|
Membership function type
|
Membership function shape
|
Control Points
|
New Raster Layer |
| landdist | Linear | Monotonically increasing | a = 100, b = 82970.50 | landfuzz |
| roadsdist | Linear | Monotonically decreasing | c = 0, d = 50030.90 | rdsfuzz |
| cpbuffdist | J- shaped curve | Monotonically increasing | a = 800, b = 8548.96 | cpfuzz |
| psbuffdist | J- shaped curve | Monotonically increasing | a = 2200, b = 10825.60 | policefuzz |
| totalcrime | J- shaped curve | Monotonically increasing | a = 819, b = 6789.00 | totalcrimefuzz |
| populationden | Linear | Monotonically increasing | a = 0, b = 5.6765 | populationdenfuzz |
| gvrd_2 | Linear | Monotonically increasing | a = 0, b = 400 | gvrd_2fuzz |
| incomeneigh | J- shaped curve | Monotonically decreasing | c = 0, d = 140884.00 | incomeneighfuzz |
| crimeassaults0401 | J- shaped curve | Monotonically increasing | a = 62*, b = 672 | assaultfuzz |
| crimeoffensive0401 | J- shaped curve | Monotonically increasing | a = 10*, b = 192 | offenfuzz |
| crimeprop0401 | J- shaped curve | Monotonically increasing | a = 714*, b = 5811 | propfuzz |
| crimepros0401 | J- shaped curve | Monotonically increasing | a = 1*, b = 81 | prosfuzzy |
| crimetraffic0401 | J- shaped curve | Monotonically increasing | a = 36*, b = 108 | trafficfuzz |
A monotonically increasing linear function was chosen because areas further away from landuse are the most suitable and suitability increases with distance, which is also applied to distance from boundaries, as suitability also increases further away from boundaries. A monotonically decreasing linear function was chosen, implying that the further away from road networks, accessibility decreases. The monotonically increasing J-shaped curve implies that neighbourhoods with a higher crime rate are more likely in need of a new police station. Assuming that more crime occurs in areas that are socially unstable with lower average household incomes, a monotonically decreasing J-shaped curve was used.
*Note: Neighbourhoods with higher crime rates are more likely in need of a new police station. Thus to determine control point "a", the median was calculated for each type of crime and for "b", the value is the highest number of that type of crime.
Below is an example of the process taken for Community Police centres.

Above: A Boolean image of the current community policing centers, assigned a value of "1".
Below: An image showing the buffer for the community policing centers.
| Value for target area | 1 |
| Value for buffer zone | 2 |
| Value for area outside buffer | 0 |
| Buffer distance | 1000 m |

Below: The DISTANCE module applied to the above image.

Below: The FUZZY module applied to the distance image.


