Geographic Information Science (GIS), mapping, and spatial analysis are effective tools in determining areas that are prone to criminal activity. Patterns and trends can be detected with the help of GIS. By mapping the crime occurrences for each neighbourhood, we can determine if there are any patterns that exist in an attempt to understand where crime occurs.
According to the Vancouver Police Department's Strategic Plan (2004-2008), the City of Vancouver is a "thriving, dynamic and unique city," (p. 10) which presents challenges that include problems such as demographic issues, drugs, property crime, and the impact of criminals arriving from other jurisdictions. The Plan identifies increasing property crime rates, where most of the stolen goods are converted into cash to buy drugs. According to The Vancouver Board of Trade, the City of Vancouver is only second to Miami, Florida, in all of North America when is comes to property crime. This is due to "a serious problem of drug addiction, insufficient numbers of police, weak sentencing of repeat offenders and inadequate funding for treatment of drug addicts" (The Vancouver Board of Trade, 2003). Furthermore, there is an increase in drug activity in Vancouver. The VPD's Strategic Plan also identifies Vancouver as a "major importer, exporter and cultivator of illegal drugs" (p. 14). Drug use is often the link to many criminal activities.
To identify spatial concentrations of crime, two general classes of methods exist, which are area-based methods and point-based methods (Williamson, McLafferty, McGuire, Ross, Mollenkopf, Goldsmith, & Quinn, 2001). This project focuses on area-based methods since the crime data I researched was only available for individual neighbourhoods. According to Williamson et al. (2001), area-based methods consist of crime data that are aggregated into geographical areas, such as census tracts and neigbourhoods. Each area is computed to determine the measure of crime intensity, such as the total number of crime or even the incidence of crime in relation to the land area, or population (Williamson et al., 2001).
Crime patterns can be analyzed with a method called block aggregation. Block aggregation is a method which "involves aggregating crime incidents into geographical areas and generating a choropleth map in which those units are shaded based on the number of incidents within them" (Williamson et al., 2001, p. 191). This allows the user to identify areas of high crime rates compared to other areas. There are many advantages and disadvantages to block aggregation. Some advantages include its ease in calculation, and an output that is simple to explain (Williamson et al., 2001). The areas with large amounts of crime can be easily identified. On the other hand, the block aggregation does not handle small amounts of data well, and the size of the block may skew the data.
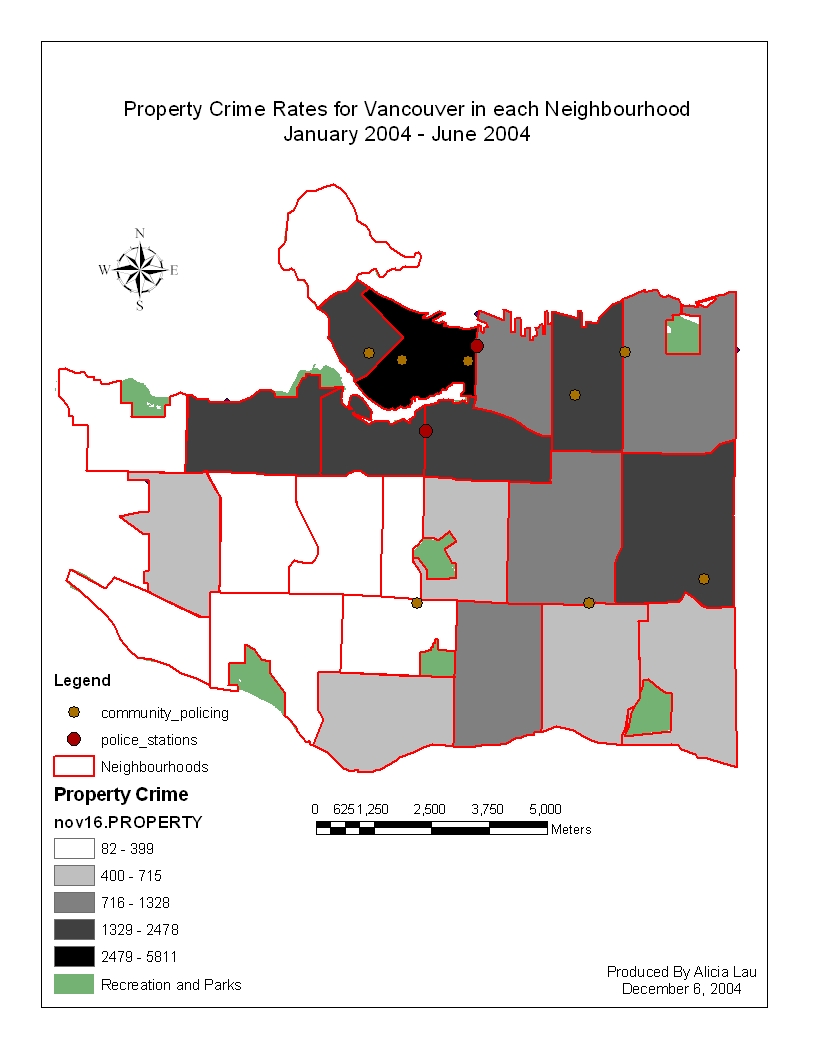
The result is a choropleth map, showing the levels of crime concentrations for each neighbourhood. A good choropleth map is visually beneficial for interpretation. An example of a choropleth map for the total property crime rates from January 2004 to June 2004 for the City of Vancouver is shown below.

The purpose of this project is to analyze crime in various neighbourhoods to determine which areas would benefit from more police resources. By mapping out the crime data for each neighbourhood in the City of Vancouver using the area-based method, and using Multi-criteria evaluation to perform the analysis, I want to determine the most suitable areas for a new police station. This project involves determining geographical concentrations of high and low crime neighbourhoods. Thus, the main question this project attempts to answer is "In what neighbourhood does crime occur the most and where would be the best location for a new police station?"


