STAT 330 Lecture 11
Reading for Today's Lecture: 9.3
Goals of Today's Lecture:
Today's notes
Two sample problems covered so far (all of which have 2 independent samples:
Matched Pairs
Examples: for each of a sample of n pitchers record
![]()
![]()
Are throwing arms longer?
![]()
![]()
Can we use

or

NO: we do not have independent samples so
![]()
Correct Solution
Define ![]() so that
so that ![]() .
Let
.
Let ![]() . Then we can translate our hypotheses:
. Then we can translate our hypotheses:
![]()
and
![]()
After subtracting to get the ![]() 's this is a 1 sample problem with
n D's.
's this is a 1 sample problem with
n D's.
Use
![]()
where n is the number of pitchers or pairs not the number of arms or
![]()
and use n-1 degrees of freedom for small n (assuming as always that the population of differences is approximately normal).
Example: 9 patients. Measure the concentration of T4 cells before and after administering some new drug.
| Patient # | Before | After | After - Before |
| 1 | 114 | 110 | -4 |
| 2 | 94 | 115 | 21 |
| 3 | 117 | 134 | 17 |
| 4 | 110 | 121 | 11 |
| 5 | 96 | 124 | 28 |
| 6 | 88 | 104 | 16 |
| 7 | 105 | 121 | 16 |
| 8 | 109 | 117 | 8 |
| 9 | 85 | 100 | 15 |
| Average | 102 | 114.9 | 12.9 |
| SD | 11.6 | 11.4 | 8.6 |
Paired t-test:
![]()
with 8 degrees of freedom. A one sided P value is about 0.1% so that there is a clear increase in T4 counts after treatment.
Wrong way:

where we have used
![]()
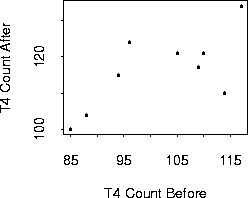
Notice that the P value, calculated now with 16 df will be much larger. The point is that the Before and After measurements on the same patient are related:

Notice that there is a trend upward to the right. Large values Before are associated with large values After.
Some Theory of Estimation
Concepts of Estimation
Setup: We have data ![]() and a model: a family
of possible probability densities for
and a model: a family
of possible probability densities for ![]() .
.
Goal: Inference about ![]() a parameter which describes the
population or true density.
a parameter which describes the
population or true density.
Point Estimate: A function ![]() of
the data whose values are `` in or near'' a set of possible
of
the data whose values are `` in or near'' a set of possible ![]() values. Typically,
values. Typically, ![]() is a real number and so is
is a real number and so is ![]() .
.
Notice: X's are random variables so ![]() is a random
variable.
is a random
variable.
Problems of Point Estimation: