Chapter Contents
Chapter Contents
Previous
Previous
Next
Next
Introduction to Discriminant Procedures

Example: Contrasting Univariate and Multivariate Analyses

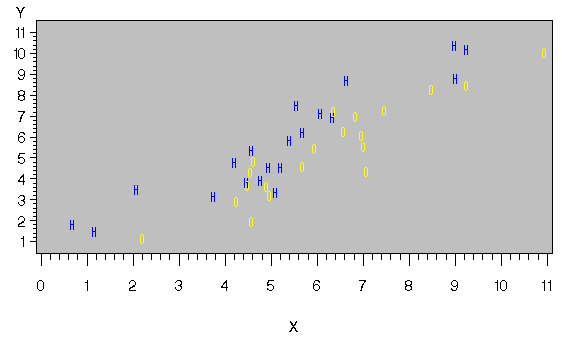
Consider the two classes indicated by `H' and `O' in Figure 7.1. The results are shown in Figure 7.2.

   data random;
      drop n;

      Group = 'H';
      do n = 1 to 20;
         X = 4.5 + 2 * normal(57391);
         Y = X + .5 + normal(57391);
         output;
      end;

      Group = 'O';
      do n = 1 to 20;
         X = 6.25 + 2 * normal(57391);
         Y = X - 1 + normal(57391);
         output;
      end;

   run;

   symbol1 v='H' c=blue;
   symbol2 v='O' c=yellow;
   proc gplot;
      plot Y*X=Group / cframe=ligr nolegend;
   run;

   proc candisc anova;
      class Group;
      var X Y;
   run;

intdisc1.gif (3538 bytes)

Figure 7.1: Groups for Contrasting Univariate and Multivariate Analyses

The CANDISC Procedure

Observations 40 DF Total 39
Variables 2 DF Within Classes 38
Classes 2 DF Between Classes 1

Class Level Information
Group Variable
Name
Frequency Weight Proportion
H H 20 20.0000 0.500000
O O 20 20.0000 0.500000

Figure 7.2: Contrasting Univariate and Multivariate Analyses

The CANDISC Procedure

Univariate Test Statistics
F Statistics, Num DF=1, Den DF=38
Variable Total
Standard
Deviation
Pooled
Standard
Deviation
Between
Standard
Deviation
R-Square R-Square
/ (1-RSq)
F Value Pr > F
X 2.1776 2.1498 0.6820 0.0503 0.0530 2.01 0.1641
Y 2.4215 2.4486 0.2047 0.0037 0.0037 0.14 0.7105

Average R-Square
Unweighted 0.0269868
Weighted by Variance 0.0245201

Multivariate Statistics and Exact F Statistics
S=1 M=0 N=17.5
Statistic Value F Value Num DF Den DF Pr > F
Wilks' Lambda 0.64203704 10.31 2 37 0.0003
Pillai's Trace 0.35796296 10.31 2 37 0.0003
Hotelling-Lawley Trace 0.55754252 10.31 2 37 0.0003
Roy's Greatest Root 0.55754252 10.31 2 37 0.0003


The CANDISC Procedure

  Canonical
Correlation
Adjusted
Canonical
Correlation
Approximate
Standard
Error
Squared
Canonical
Correlation
Eigenvalues of Inv(E)*H
= CanRsq/(1-CanRsq)
Test of H0: The canonical correlations in
the
current row and all that follow are zero
  Eigenvalue Difference Proportion Cumulative Likelihood
Ratio
Approximate
F Value
Num DF Den DF Pr > F
1 0.598300 0.589467 0.102808 0.357963 0.5575   1.0000 1.0000 0.64203704 10.31 2 37 0.0003

NOTE: The F statistic is exact.


The CANDISC Procedure

Total Canonical Structure
Variable Can1
X -0.374883
Y 0.101206

Between Canonical
Structure
Variable Can1
X -1.000000
Y 1.000000

Pooled Within Canonical
Structure
Variable Can1
X -0.308237
Y 0.081243


The CANDISC Procedure

Total-Sample Standardized
Canonical Coefficients
Variable Can1
X -2.625596855
Y 2.446680169

Pooled Within-Class
Standardized Canonical
Coefficients
Variable Can1
X -2.592150014
Y 2.474116072

Raw Canonical Coefficients
Variable Can1
X -1.205756217
Y 1.010412967

Class Means on Canonical
Variables
Group Can1
H 0.7277811475
O -.7277811475

The univariate R2s are very small, 0.0503 for X and 0.0037 for Y, and neither variable shows a significant difference between the classes at the 0.10 level.

The multivariate test for differences between the classes is significant at the 0.0003 level. Thus, the multivariate analysis has found a highly significant difference, whereas the univariate analyses failed to achieve even the 0.10 level. The Raw Canonical Coefficients for the first canonical variable, Can1, show that the classes differ most widely on the linear combination -1.205756217 X + 1.010412967 Y or approximately Y - 1.2 X. The R2 between Can1 and the class variable is 0.357963 as given by the Squared Canonical Correlation, which is much higher than either univariate R2.

In this example, the variables are highly correlated within classes. If the within-class correlation were smaller, there would be greater agreement between the univariate and multivariate analyses.

Chapter Contents
Chapter Contents
Previous
Previous
Next
Next
Top
Top

Copyright © 1999 by SAS Institute Inc., Cary, NC, USA. All rights reserved.