Chapter Contents
Previous
Next
|
Chapter Contents |
Previous |
Next |
| The REG Procedure |
   data annote1;
      length function color $8;
      retain ysys xsys '2' color 'black';
      function='move';
         x=0;
         y=0;
         output;
      function='draw';
         x=1;
         y=1;
         output;
   run;

   symbol1 c=blue;
   proc reg data=fitness;
      title 'PP Plot';
      model Oxygen=RunTime / noprint;
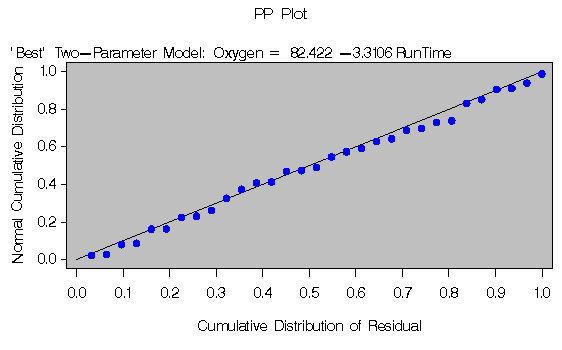
      plot npp.*r.
           / annotate=annote1 nostat cframe=ligr
             modellab="'Best' Two-Parameter Model:";
   run;
      title 'QQ Plot';
      plot r.*nqq.
           / noline mse cframe=ligr
             modellab="'Best' Two-Parameter Model:";
   run;
Output 55.8.1: Normal Probability-Probability Plot for the Residuals

|

|
|
Chapter Contents |
Previous |
Next |
Top |
Copyright © 1999 by SAS Institute Inc., Cary, NC, USA. All rights reserved.