Chapter Contents
Previous
Next
|
Chapter Contents |
Previous |
Next |
| XRCHART Statement |
| See SHWXR4 in the SAS/QC Sample Library |
The following data set (WIRE) contains breaking strength measurements recorded in pounds per inch for 25 samples from a metal wire manufacturing process. The subgroup sample sizes vary between 3 and 7.
   data wire;
      input day size @;
      informat day date7.;
      format day date7.;
      do i=1 to size;
         input brstr @@;
         output;
         end;
      drop i size;
      label brstr  ='Breaking Strength (lb/in)';
      datalines;
   20JUN94 5 60.6 62.3 62.0 60.4 59.9
   21JUN94 5 61.9 62.1 60.6 58.9 65.3
   22JUN94 4 57.8 60.5 60.1 57.7
   23JUN94 5 56.8 62.5 60.1 62.9 58.9
   24JUN94 5 63.0 60.7 57.2 61.0 53.5
   25JUN94 7 58.7 60.1 59.7 60.1 59.1 57.3 60.9
   26JUN94 5 59.3 61.7 59.1 58.1 60.3
   27JUN94 5 61.3 58.5 57.8 61.0 58.6
   28JUN94 6 59.5 58.3 57.5 59.4 61.5 59.6
   29JUN94 5 61.7 60.7 57.2 56.5 61.5
   30JUN94 3 63.9 61.6 60.9
   01JUL94 5 58.7 61.4 62.4 57.3 60.5
   02JUL94 5 56.8 58.5 55.7 63.0 62.7
   03JUL94 5 62.1 60.6 62.1 58.7 58.3
   04JUL94 5 59.1 60.4 60.4 59.0 64.1
   05JUL94 5 59.9 58.8 59.2 63.0 64.9
   06JUL94 6 58.8 62.4 59.4 57.1 61.2 58.6
   07JUL94 5 60.3 58.7 60.5 58.6 56.2
   08JUL94 5 59.2 59.8 59.7 59.3 60.0
   09JUL94 5 62.3 56.0 57.0 61.8 58.8
   10JUL94 4 60.5 62.0 61.4 57.7
   11JUL94 4 59.3 62.4 60.4 60.0
   12JUL94 5 62.4 61.3 60.5 57.7 60.2
   13JUL94 5 61.2 55.5 60.2 60.4 62.4
   14JUL94 5 59.0 66.1 57.7 58.5 58.9
   ;
The following statements request ![]() and R charts, shown in
Output 43.3.1, for the strength measurements:
and R charts, shown in
Output 43.3.1, for the strength measurements:
   title 'Mean and Range Charts for Breaking Strengths';
   symbol v=dot c=salmon;
   proc shewhart data=wire;
      xrchart brstr*day / nohlabel
                          cframe   = bigb
                          cinfill  = ywh
                          cconnect = salmon;
   run;
Output 43.3.1:

|
The XRCHART statement provides various options for working with unequal subgroup sample sizes. For example, you can use the LIMITN= option to specify a fixed (nominal) sample size for computing control limits, as illustrated by the following statements:
   proc shewhart data=wire;
      xrchart brstr*day / nohlabel
                          limitn   = 5
                          cframe   = bigb
                          cinfill  = ywh
                          cconnect = salmon;
   run;
The resulting charts are shown in Output 43.3.2.
Output 43.3.2: Control Limits Based on Fixed Sample Size

|
   proc shewhart data=wire;
      xrchart brstr*day / nohlabel
                          limitn   = 5
                          alln
                          nmarkers
                          cframe   = bigb
                          cinfill  = ywh
                          cconnect = salmon;
   run;
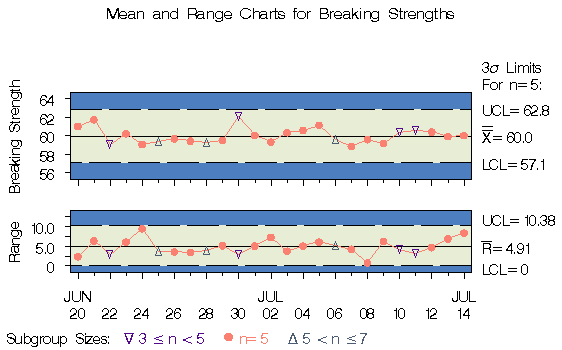
The charts are shown in Output 43.3.3. The NMARKERS option requests special symbols to identify points for which the subgroup sample size differs from the nominal sample size.
Output 43.3.3: Displaying All Subgroups Regardless of Sample Size

|
The following statements apply both methods:
   proc shewhart data=wire;
      xrchart brstr*day / outlimits = wlim1
                          outindex  = 'Default'
                          nochart;
      xrchart brstr*day / smethod   = mvlue
                          outlimits = wlim2
                          outindex  = 'MVLUE'
                          nochart;
   run;


   data wlimits;
      set wlim1 wlim2;
   run;
The data set WLIMITS is listed in Output 43.3.4.
Output 43.3.4: Listing of the Data Set WLIMITS
|
Chapter Contents |
Previous |
Next |
Top |
Copyright © 1999 by SAS Institute Inc., Cary, NC, USA. All rights reserved.