Summary of Fit
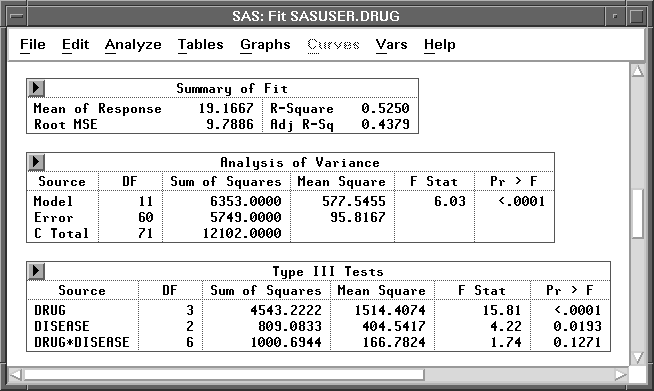
The Summary of Fit table, as shown in Figure 15.7,
contains summary statistics.
The Mean of Response 19.1667 is
the overall mean of CHANG_BP.
The Root MSE 9.7886 is the square root of the mean
square error given in the Analysis of Variance table.
Root MSE is an estimate of  in the preceding
analysis of variance model.
The R-Square value is 0.5250, which means that 52% of
the variation in CHANG_BP is explained by the fitted model.
Adj R-Sq is an alternative to R-Square,
adjusted for the number of parameters in the model.

Figure 15.7: Fit Window - Summary of Fit
Copyright © 1999 by SAS Institute Inc., Cary, NC, USA. All rights reserved.
