Non-Market Housing in Vancouver

Spatial Analysis


Upon having the appropriate coverages needed to conduct my spatial analysis, I was then able to prepare for my Multi-Criteria Evaluation using a Weighted Linear Combination.  To show the most appropriate area for new non-market housing units, I needed to calculate the distance from commercial areas, skytrain stations and parks.  This gave me distances beyond the spatial scope of my project (Vancouver), so I then overlaid (logical Boolean AND) these distances with my Vancouver coverage.  Click here to see the resulting Distance Coverages .  To each of these new coverages, I assigned fuzzy values with a linear monotonically decreasing function, where a = 0 and b = 800.  800 meters was chosen to be the maximum distance to travel by foot to these amenities.  I also assigned fuzzy values to the residential types, the average annual household income, and the total number of non-market housing units.  To see these fuzzy coverages, please click here .

These fuzzy values created new images which were then assigned weights .  These images and weighted values could then be applied to the Multi-Criteria Evaluation WLC function.  Click to see the resulting images and cartographic model .

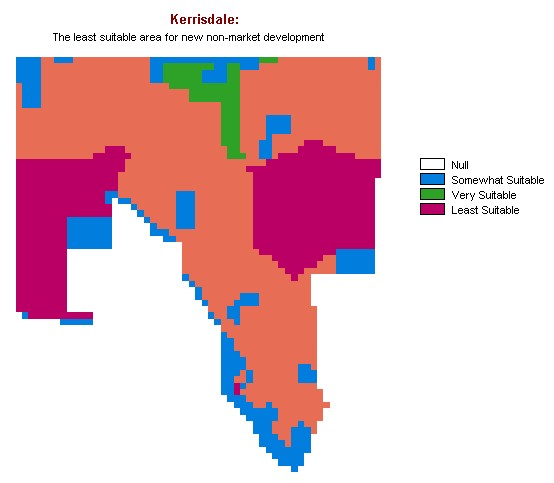
By overlaying (logical Boolean OR)  the dotareas coverage with the suitability coverage, I was able to determine the best and worst neighbourhoods to develop in.  According to my analysis, Grandview Woodlands is the best nieghbourhood to develop new non-market housing, while Kerrisdale is the worst.  Below are the corresponding images.
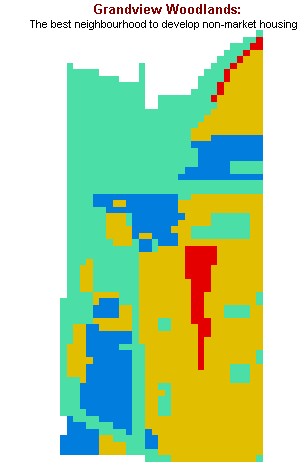
Grandview legend


Kerrisdale


To contextualize both of the above images, the following map is that of Vancouver
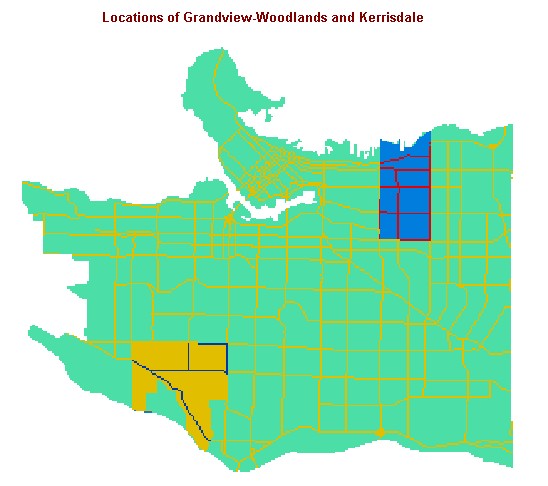

Grandview and Kerrisdale


Next: Problems and Discussion

Back to Table of Contents