Non-Market Housing in Vancouver
Methodology
Walking distance is a very important factor to consider when evaluating
the best location for non-market housing. I believe that a 10 minute
walking distance is the most optimal distance to walk from a dwelling to
a service or amenity (such as Skytrain, commercial location, or parks).
On average, I estimate a 10 minute walk to be 800 meters. This is a
generous estimate, but it will account for hills, seniors and people with
disabilities, and designated routes (where people must either follow a road
or a path).
In order to confirm that non-market housing units are located in areas
of lower income, I prepared a regression graph. There is an inverse
relationship between average annual income and total number of housing units.
As income increases, the number of units decreases. There is not a
very strong relationship between the two (r = -0.69), however the relationship
exists.
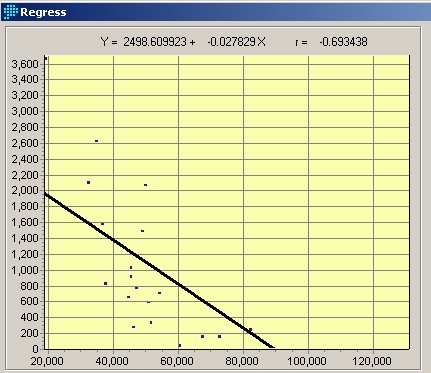

Regression Line For Average Household Income vs. Total Number of Units

The Corresponding Cartographic Model for the REGRESS Function
My original data did not contain information on the total number of housing
units per planning subdivision, so I edited the dotareas table to
reflect this statistic. To display the average household income and
total number of units, I edited a new table for each and then assigned them
to the dotareas layer to create new layers.
Before I was able to conduct my spatial analysis, I needed to digitize
the locations for all of the Skytrain stations in Vancouver. This was
done by comparing the layers in my data to the Translink map on the Internet
and their written descriptions. I first needed to convert my streets
data and skytrain line data into Raster format and overlay (logical Boolean
OR) the two. I then digitized the stations in Vector format, and converted
the Vector data into Raster. This gave me 11 classes (one for each
station), which I then reclassed in to one class. The following is
a cartographic model that shows the steps that I took.

.
Cartographic model for achieving the Boolean skytrain
station image.
Because the majority of my data was for all of the municipalities in the
GVRD, I reclassed the cities so that all but Vancouver had a value of zero,
including the University Endownment Lands. Then, to find out what
land uses were in Vancouver, I overlaid (logical Boolean AND) my new Vancouver
layer with the landuse layer.

Cartographic Model for Vancouver's Land Uses
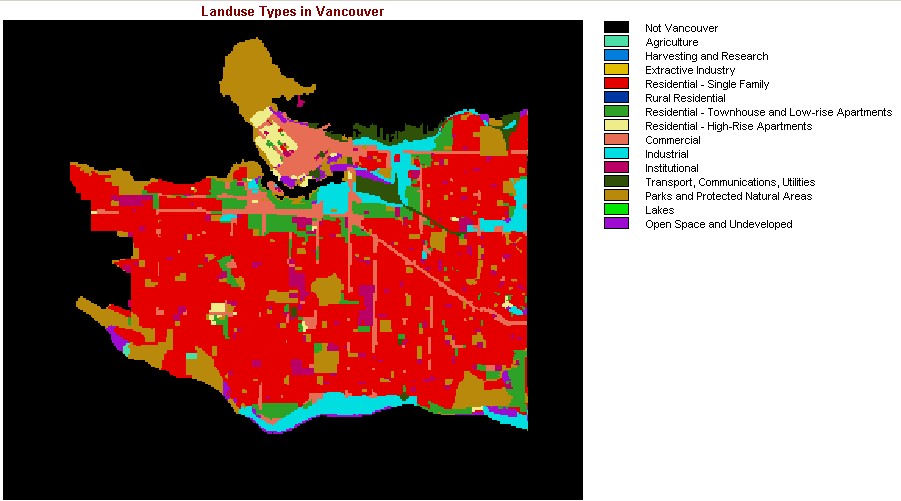
Land Uses in Vancouver
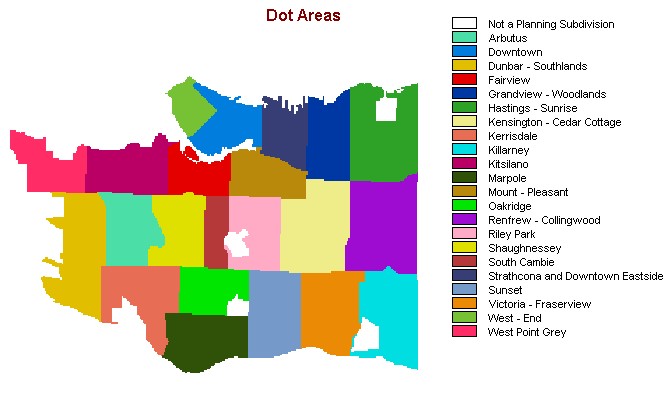
My data for the dotareas (planning subdivisions)
were originally in ArcView Shapefile format, therefore I imported this file
into IDRISI using the ESRI software-specfic format SHAPEIDR. The vector
data was then converted into Raster format. The information I used
from this vector collection was the average annual household income.
I added data to the database for the total number of existing low income
housing units.
Cartographic Model for Converting Data from ArcView
to IDRISI Raster format.
The only suitable areas for the new development would be in residentially
zoned land. This means that I must place a constraint on my analysis,
where only residential areas are suitable, and all other areas are unsuitable.
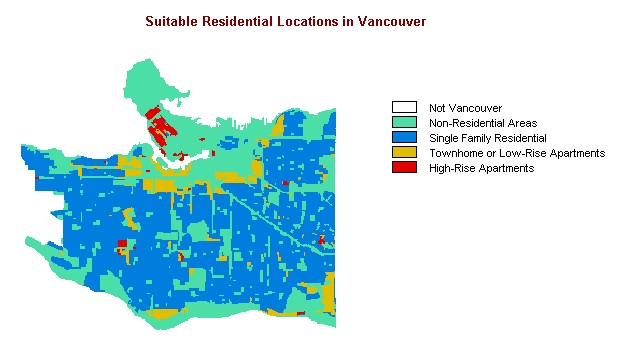
When the residential areas are reclassified into one group, they create a
contraint for the analysis
Next: Spatial Analysis
Back to Table of Contents


 .
.


