Methodology - The Cartographic Model
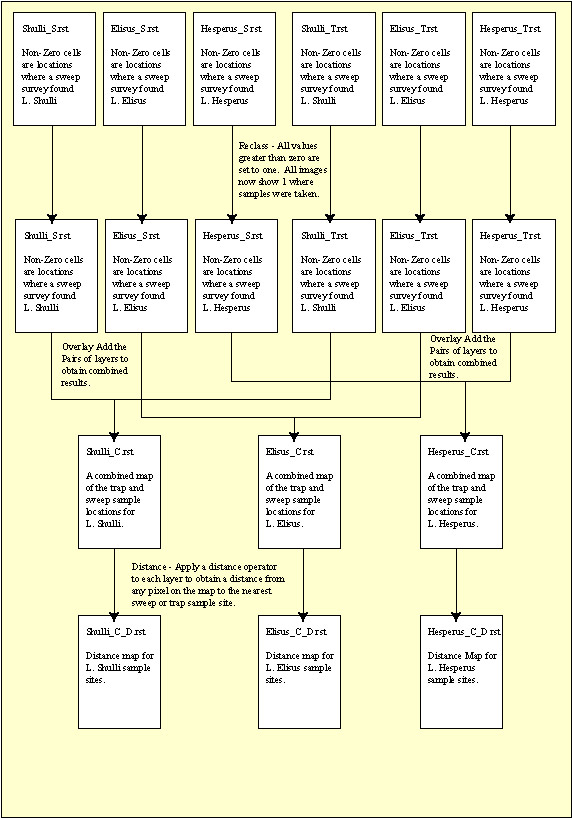
There are two primary parts of the actual analysis that was done. The
first part was the generation of a distance map for all the sample points.
To accomplish this, all the data needed to be converted to boolean form
and the trap and sweep data needed to be combined together into a single map.
A simple reclass operation was used to convert the maps to boolean form
and then an overlay add operation was used to combine the trap and sweep data
sets for each insect. This produced three maps, each one showing all
the sample sites from this project. Finally to complete this part, a
distance operator was applied to each of the three combined maps.
Figure - Cartographic Model Part II - Creating a Distance Map for the Region
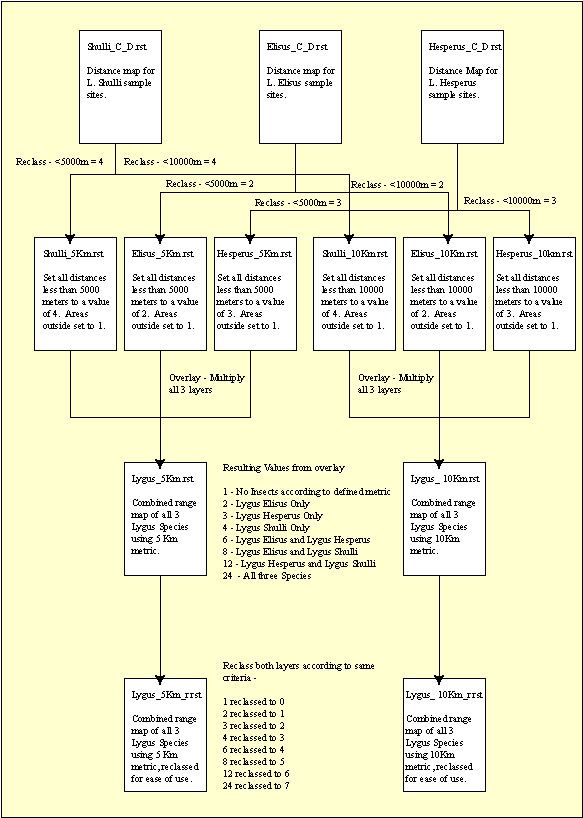
The second part of this analysis is the generation of two range maps. Each
range map will overlay the estimated ranges of all three insect species to
allow comparison between them. To determine the range of the species
based on a sample point, I decided to extrapolate the insect ranges from
the sample points based on their ability to travel. One map will assume
that the sample is accurate to a distance of 5 km from a sample sites and
the other map do the same thing at a distance of 10 km. I will then compare
the resulting ranges and discuss which is more effective.
Combining the three insect species presented an interesting problem. How
to combine the three ranges to get unique values for each combination of the
three insects. The solution is to use some fancy reclassification along with
an overlay multiply operation. For this to work, the areas that are
outside of the metric range according to the distance map results need to
be set to 1. The areas inside the metric range will be set to different
values for each insect species. The values set were 2, 3 and 4 for Lygus
Elisus, Hesperus and Shulli respectively. This allows overlay multiplication
to produce unique results. Then a simple reclassification to produce
a tidy final map.
Figure - Cartographic Model Part III - Generating the reclassed range maps
using two different metrics.
The final step to producing the output maps was to find some sort of reference
information for the region. Thanks to additional data provided by Dr
Gillespie, I have complete maps of waterways, coastline, highways and major
roads for the region. This is enough information to provide geographical
reference to the maps so we can determine what these ranges mean in terms
of the real world.
Go to the Previous Page
Return to
Table of Contents
Go to the Next Page