Data Collection and Information
The data on the insects in this project was collected in two ways. The
first was using traps to catch the insects. Yellow sticky traps were
set up at a series of greenhouse operations throughout the valley. These
traps were checked periodically throughout the summer of the project and
the presence or absence of each insect species was recorded. The other
method used was the sweep method. The basic concept of the sweeping
method of collection is to take a net and brush it through foliage to catch
any insects hiding in the foliage. Based on the results, the sweeping
method seems to be more appropriate for catch Lygus since the numbers of
insects found was much greater that the results from the trap method.
The original data used in this project was not in a geographical database.
Instead all the data, including the UTM coordinates was stored in
a pair of Microsoft Excel files, one for the trap data and one for the sweep
data. The coordinates were stored in a single column, in the form UT10526536
5432995. This coordinate states that we are using the UTM 10N coordinate
system, with x and y coordinates equal to 526536 and 5432995 respectively.
The entire database had to be reprocessed to two columns of X and
Y coordinates for the next stage of the project. In addition, there
was a great deal of data that was of no use to the project, including the
current status of the insect samples. The databases were simplified
down to only information about whether or not each species of Lygus was found
in a specific area.
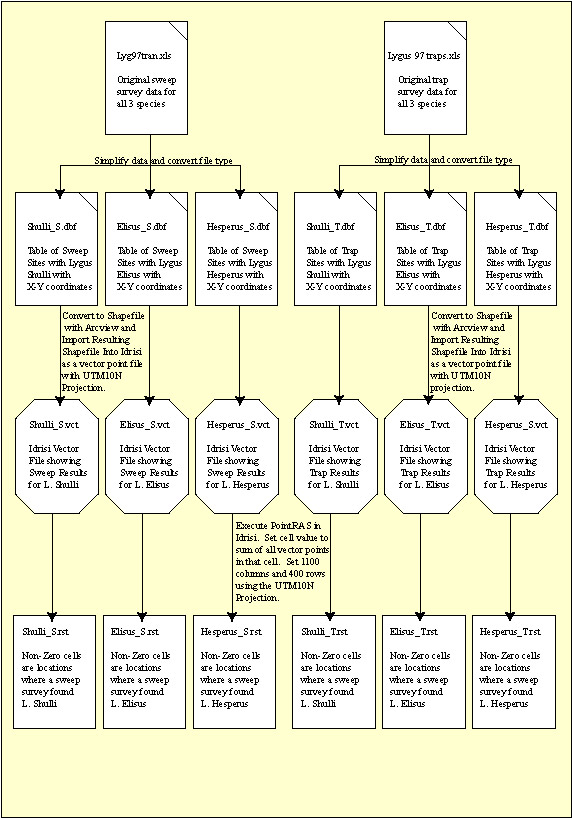
Next, 6 separate tables were created in the same .dbf format as used by
Arcview. There is a trap table and a sweep table for each of Lygus
Shulli, Lygus Hesperus and Lygus Elisus. Each table only contains the
coordinates of samples where that insect was found. Sample sites with
a false result were not kept for this experiment. Finally, the resultant
tables were each taken through a series of data conversions, finally resulting
in a set of 6 Idrisi raster files with a non zero value in a raster cell
representing the sample sites. The conversion process is detailed in
the diagram below. Once the conversion steps are complete it is time
to run the actual data analysis.
Figure: Cartographic Model Part I - Pre Analysis Data Preparation.
Go to the Previous Page
Return to
Table of Contents
Go to the Next Page