The following is an outline of the steps taken with the availabe datasets to produce the final Hazard Assessment map for Vanderhoof forest district:
1) The six desired forest cover (fc1) and trim files were first converted to ArcView shapefiles using FME universal translater.
The data was already projected as UTM Zone 10, Nad 83 with a scale of 1:20,000 and thus did not require further manipulation.
2) The forest layer (fip) file was converted to a dBase file using FME Universal Translator.
3) The six trim files were merged in ArcView to create one trim.shp file.
4) The six forest layer dBases were joined in ArcView to the six forest cover shape files based on the map id number. Following this the
six forest covers were merged to create one shape file, forest.shp.
5) The forest.shp file was then summarized based on the map id number with inventory group number, age class, height class, stocking class code and area being maintained. This file was named forest2.shp
6) A new column called stratum was added to the forest2.shp file based on the inventory group number, age class, height class and stocking class code. This was created so the basal area look-up table could be joined to this shapefile.
7) Using ArcView query, pine stands with inventory group numbers ranging from 28-31 were isolated and converted to a shapefile called forest_pine.shp. This was done in order to isolate pine stands.
8) In order to calculate the location variable, the XY extension was used in ArcView to calculate the latitude and longitude of each polygon in the forest_pine.shp file.
9) The basal area look-up table, where the percent susceptible pine basal area was derived from, was then converted in Excel to a dBase file and joined to the forest_pine.shp file in ArcView.
10) Percent susceptible pine basal area per hectare was then calculated on the forest_pine.shp file in ArcView and added as a new field.
11) The trim.shp file was converted into a surface using tin conversion in ArcView and called trim_tin.shp. This method was chosen for lack of a better option in either ArcView or IDRISI.
12) The trim_tin.shp was converted to a grid using ArcView and called grid.
13) The grid was exported as an ASCII file.
14) The grid and forest_pine.shp files were then imported into IDRISI.
STEPS IN IDRISI
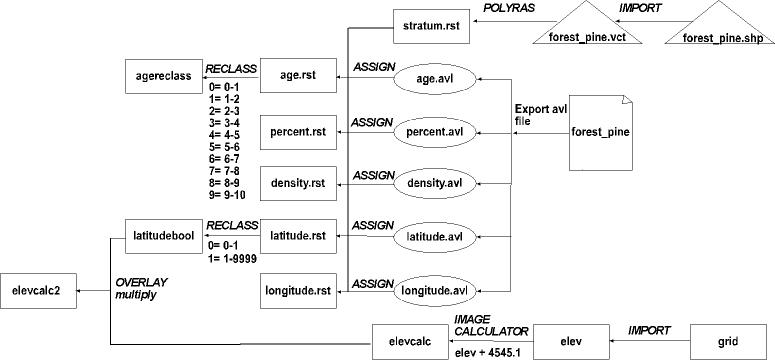
The Cartographic models below show the steps involved in IDRISI however, the following is an outline of
the main operations which led to the creation of the final hazard assessment map.
1) Once the shape files were imported into IDRISI, they were converted to raster layers. Grid was renamed elev and forest_pine was renamed stratum.
2) .Avl files were created using the Export (Avl) option in the database workshop, based on the stratum layers dBase.
3) The .avl files were then used to create the layers age, percent, density, latitude and longitudelat.
4) Age was reclassed to non-decimal values and called agereclass.
5) A boolean image was then created from the latitude layer with any values above 1 as 1 and any values below 1 as 0; the layer was called latbool.
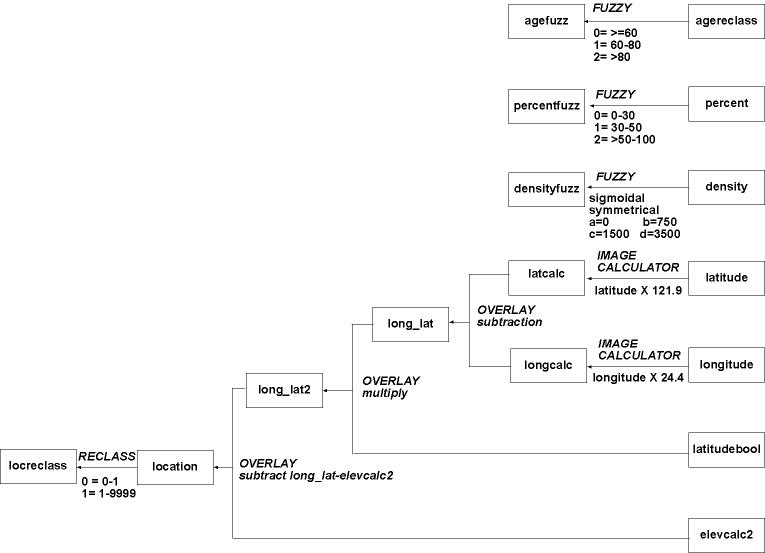
6) The latitude layer was multiplied in image calculator by 121.9 and renamed latcalc and longitude layer was multiplied by 24.4 and renamed longcalc.
7) The latcalc layer was then subtracted from the longcalc layer and the new layer was called long_lat.
8) 4545.1 was added to the elevation layer and renamed elevcalc.
9) The latbool layer was overlay multiplied by the elevcalc and long_lat layers to mask out unwanted areas. The new layers were renamed as elevcalc2 and long_lat2.
10) elevcalc2 was then subtracted from long_lat2 to create the map layer called location (Figure
8).
11) Because all values were above zero, a boolean image was created.
12) Fuzzy classes were then created for the 3 remaining factors; age, density and percent.
13) Age and percent were classed based on the age class and percent susceptible
pine basal area factor and density was classed based on the
density class factor (see methodology page), using the sigmoidal,
symmetric option in the fuzzy module. These layers were renamed
as agefuzz, percentfuzz and densityfuzz (Figures
5-7)
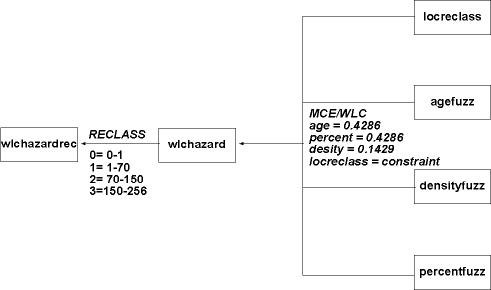
14) A weight matrix was then created using the weight module. Agefuzz and percentfuzz were weighted heavier than density because if there are only young, small diameter trees in a stand, the MPB
is unlikely to wage a successful attack. Weights were as follows: agefuzz and percentfuzz = 1 and densityfuzz = 1/3.
15) MCE was used with locbool as a constraint and percentfuzz,
agefuzz and densityfuzz as factors. The newly created weight
file was applied and a layer with 0-255 categories was created
and called wlchazard.
16) wlchazard was then reclassified based on the values identified
with the collection editor into unknown, low, med and high hazard
classes and called wlchazardrec (Figure
9).
CARTOGRAPHIC MODELS:
(1) 
(2)

(3)


