METHODOLOGY
The Hazard assessment used in this analysis was based on the one
used by the Ministry of Forests (MOF) and others to identify those
stands which are susceptible to MPB infestation damage. The factors
for the criteria used in the MOF hazard assessment were modified
to facilitate the creation of factor maps with the "fuzzy"
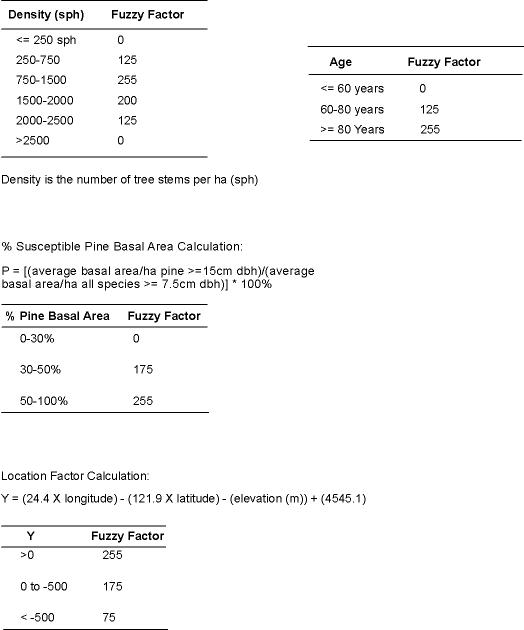
module in IDRISI. The age, density, percent of susectible pine
basal area (percent) and location weighting factors were modified
to integers ranging from 0-255. "Fuzzy" maps were created
for age, density and percent (Figures 5-7).
The calculations for the modified factors are listed below.

Through the employment of the MCE module, a weighted linear combination
(WLC) was calculated using percentfuzz, agefuzz and densityfuzz
as factors and location as a constraint. Location was used as
a constraint as it was found that the areas all had a value greater
than one. This resulted in the creation of a boolean image of
high risk and low risk (Figure 8).
Since all areas in this particular study, for which there were
values, were high risk locations, it was deemed a constraint.
The weights for the WLC of the agefuzz, percentfuzz and densityfuzz factors were as
follows: agefuzz = 0.4286, percentfuzz = 0.4286 and densityfuzz = 0.1429. The densityfuzz
factor was deemed slightly less important due to the fact that
if a stand was immature and had a lower percent of susceptible
pine basal area (diameter of tree at breast height (dbh) less than 15cm),
then density wouldn't be as much of an issue for this particular
pest.
The outcome of the WLC was a hazard map showing a range of
values from low to high, based on a range from 0-255. The map
was reclassed for display. The classes for the map were identified
through employing the collection editor to group the newly created
WLC image (wlchazard) with the agefuzz, densityfuzz and percentfuzz
layers. The wlchazard layer was then queried using the feature
properties and curser enquiry modes to identify the low, medium,
and high classes based on the range of 0-255 used in the
WLC. The map was then reclassed based on these, and a legend
was created (Figure 9).
Back
Next


