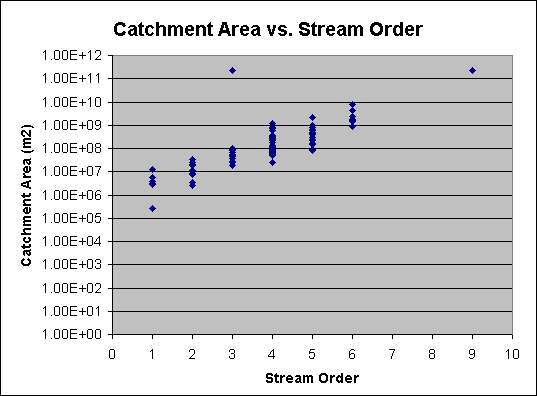

Figure 6. Catchment area versus stream order, for the 94 hydrologic stations of the Georgia Basin, showing a positive relationship. Note that the vertical scale is logarithmic. Also note the extreme outlier for stream order 3, which I will assume is not an error.