
Spatial Analysis:
Below is a summary of the analysis I performed. Click on the links to see more images.
1) VECTOR TO RASTER CONVERSION:
The first step was to convert the vector line files MJROADS, VAN_BUS and SKYTRAIN to raster images using the LINERAS module. I found that the data type needed to be converted to integer for the module to be successful. Once the images were successfully converted to raster format, I then used RECLASS to produce boolean images of the transportation routes (this needed to be done as the images had different values for each cell and I needed to make it a continuous image).
MJROADS_BOOL | VANBUS_BOOL | SKYTRAIN_BOOL
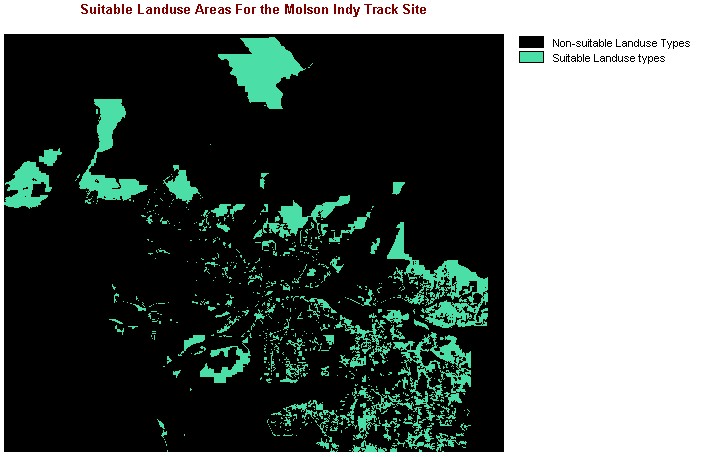
As noted in the FIVE FACTORS, the main landuse type that I wished to consider was open and undeveloped areas. However, if necessary, agricultural areas could also be considered. This involved using the EDIT function to create an attribute values file called LU_SUIT.AVL and using assign to give a value of 1 to all open/undeveloped areas and agricultural areas. The result was a boolean image LANDUSE_SUIT showing desirable landuse types. A similar process was also used to produce a boolean image for desirable municipalities (CITY_SUIT) and residential and commercial areas (LU_DEVELOP). The images LANDUSE_SUIT and CITY_SUIT would serve as constraining factors in that we only wished to consider landuses of open/undeveloped and agricultural areas and the municipalities of Vancouver, West Vancouver, North Vancouver, Richmond, Burnaby, New Westminster and the University Endowment Lands. The image LU_DEVELOP would be used as a factor to determine distance away from residential communities and commercial areas.

3) CALCULATING SLOPE:
One of the criteria identified
in the FIVE FACTORS was that the
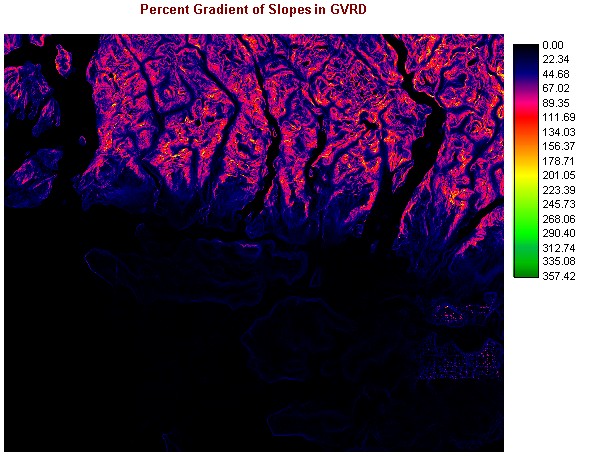
most ideal location would be on flat land. I decided that anything
below 15 degrees would be acceptable. The module SURFACE was used
on the image GVRD_DEM to produce the image GVRD_SLOPES, showing the slope
of land (percent gradient).
4) CALCULATING DISTANCES FROM TRANSPORTATION ROUTES AND RESIDENTIAL/COMMERCIAL AREAS:
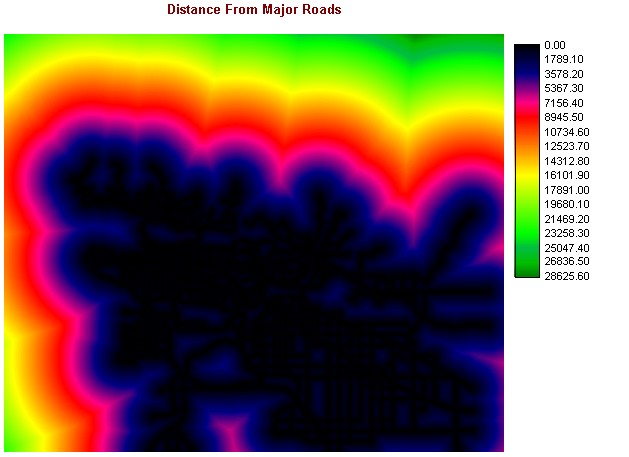
The DISTANCE module was used to calculate the distance (in meters) from major road networks, bus routes, skytrain and residential and commercial areas. The transportation distance images were used to identify locations close to public transit and roads so that spectators of the race could have easy access, while the residential/commercial distance map was used to identify areas farther away from urban areas to help alleviate resident/business disruption during the event.
VANBUS_DIST | SKYTRAIN_DIST | DEVELOP_DIST
On the continuous scale (fuzzy scale) of 0-255, I assigned suitability ratings for each factor (255 being the highest rating and 0 being the lowest). For the images LANDUSE_SUIT and CITY_SUIT I used edit/ASSIGN to give suitability values for each of the desired municipalities and landuse types. For the transportation images, slope image and the residential/commercial areas image, the module FUZZY was used to assign suitability values.
When creating the fuzzy (suitability) images for the transportation data, I used a J-shaped function (signifying that suitability values decrease as distance increases, but will not reach zero). I gave the control point values c and d as follows:
MJROADS_FUZZ c = 100, d = 500
VANBUS_FUZZ c =
100, d = 1000
SKYTRAIN_FUZZ c = 100, d = 1000
The fuzzy image for the slope was created with a sigmoidal curve (signifying that suitability does not increase with distance in a constant fashion), and the control points were given the following values:
SLOPE_FUZZ c = 0, d = 15
Lastly, the fuzzy image created for the distance from urban areas image used a linear function (suitability increases with distance) and the control points used were:
DEVELOP_FUZZ c = 500, d = 1500
CITY_FUZZ | DEVELOP_FUZZ | SLOPE_FUZZ | MJROADS_FUZZ | SKTRAIN_FUZZ | VANBUS_FUZZ
6) WEIGHTING THE FACTORS:
The Weighted Linear Combination
method of a Multi Criteria Evaluation allows us to assign relative weights
to each of our factors, thus, we can weight one factor more heavily than
another if we wish to do so. For this analysis, since the current
track infringes on developed land, I decided that the most important factor
would be landuse, and thus I weighted it accordingly. Using the WEIGHT
module, I defined a pairwise comparison matrix which indicated the importance
of any one factor relative to another. The matrix is read by considering
the variable on the y axis to be some value more important/unimportant
than the variable on the x axis. For example, DEVELOP_FUZZ is considered
to be 2 times more important than CITY_FUZZ.
|
|
|
|
|
|
|
|
|
|
|
|
||||||
|
|
|
|
|||||
|
|
|
|
|
||||
|
|
|
|
|
|
|||
|
|
|
|
|
|
|
||
|
|
|
|
|
|
|
|
|
|
|
|
|
|
|
|
|
|
Once the matrix was defined, the weights were calculated and stored to a .pcf (pairwise comparison file) and to a .dsf (decision support file, which will be recalled in the MCE analysis) called newindysite_weight.pcf & .dsf..
Calculated Weights:
|
|
|
|
|
|
|
|
|
|
|
|
|
|
|
|
|
|
|
|
|
7) MULTI CRITERIA EVALUATION USING A WEIGHT LINEAR COMBINATION:
The MCE was run with the Weighted Linear Combination option, using the parameters contained in the decision support file newindysite_weight.dsf. The boolean images CITY_SUIT and LANDUSE_SUIT were also used as constraints (to mask out areas that should not be considered). The resulting image will show suitable areas with values ranging from 0-255 (Again, 255 being the most suitable).
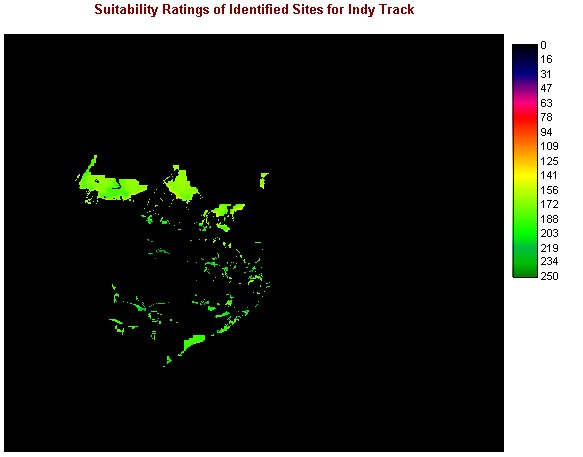
8) OBTAINING FINAL IMAGES (SUITABILITY SITE SELECTION):
Once the suitability ratings for possible sites were identified, I RECLASSed the image so that suitability values of 175 - 255 were given a value of 1 (acceptable) and values below 175 were given a value of 0 (unacceptable).
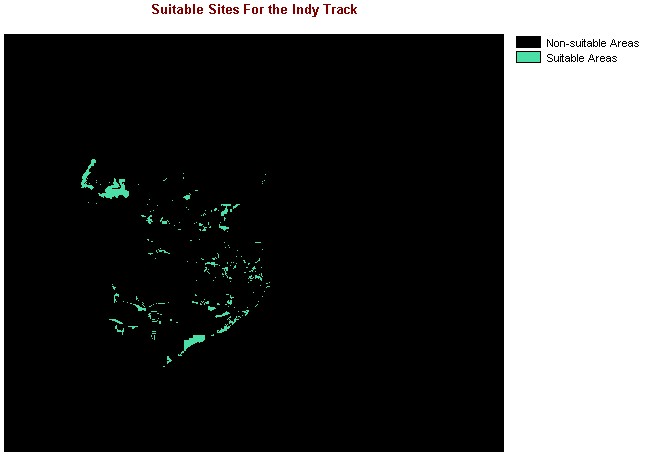
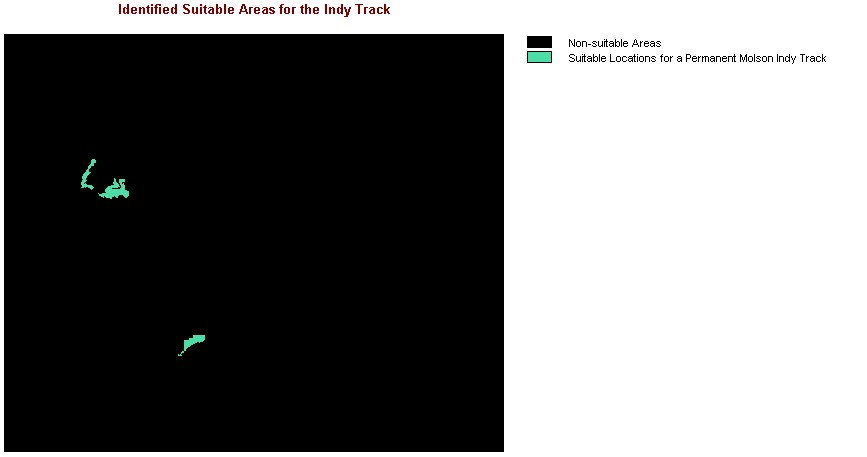
Next, the final criteria of the new site was that it was to be of at least 1.5 sq. km in area (in order to house grandstands, hospitality areas and the track itself). I calculated this value by adding the area needed for grandstands etc. (130 acres = ~0.5 sq. km) and an approximate area needed to contain the track (~ 1 sq. km). To find sites of a suitable size, I had to GROUP all the possible sites and then use AREA to calculate the area of all possible sites. After this, I then RECLASSed the image to eliminate all sites that were not of the required area. The final image, SUITINDY_AREA15, appears below, showing three possible locations for the Molson Indy race track.
