The preliminary images
1. Zone
2. Elevation
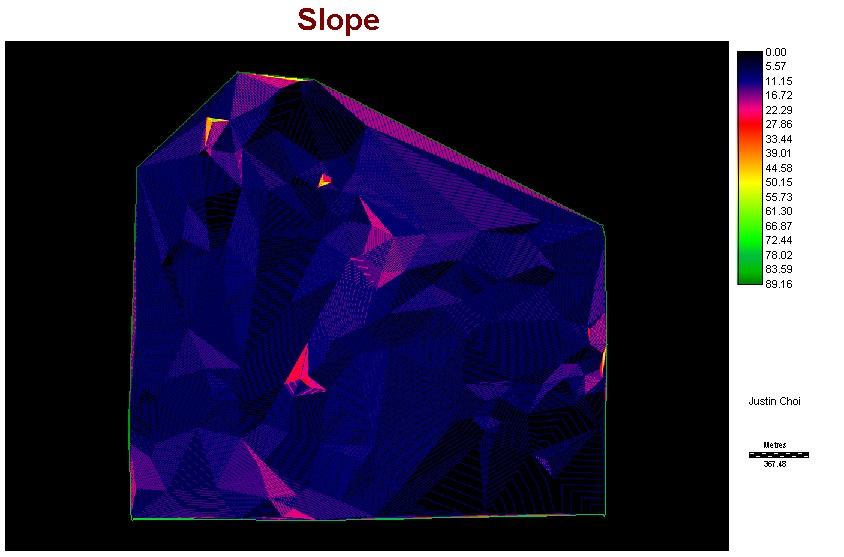
3. Slope
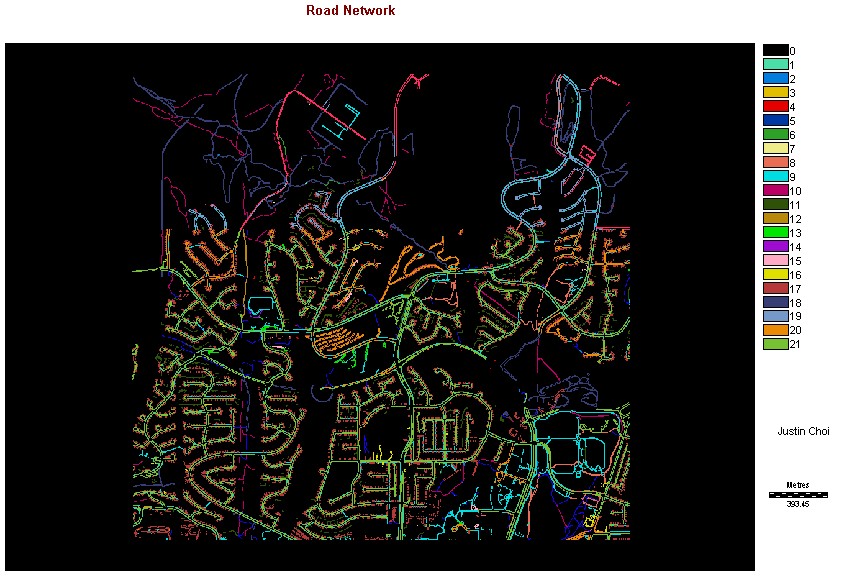
4. Road
Zone Map
The zoning map represent the different zoning imposed
by the City bylaw. However, there are some discrepancies with the reality.
This was amended by linking the database of the Zoning
map with the Cadastral map. It allowed more accurate and up-to-date
representation of the area in terms of type of residence
and commercial, civic activities.
Elevation map
The elevation map was created from the spot elevation
data in ArcView. It was imported from the ArcView directly.
The gradual elevation could be shown as we go northward.
Slope map
The Slope data was derived from the elevation model, using
the "SLOPE" function.
Some steep uphills are shown, scattered around the map.

Road map
The road network displays 21 different categories of roads.

The images after the preliminary evaluation
1. Zone after ASSIGN analysis
2. Elevation after FUZZY analysis
3. Slope after FUZZY analysis
4. Road after ASSIGN analysis
5. Road after BUFFER analysis