Objective
The aim of this project is to find out the optimal garbage
pickup route for the Town Centre area by comparing
the maximum coverage area from the routes that has been
chosen. The area selected is the upper part of
the Town Centre area near the Johnson and Guilford which
is mostly a residential area and the selected four roads
are picked based on their size (paved double lane) for
their accessibility. Based on the set assumptions and the categories,
each route will be analysed of its effectivity and coverage.
Assumption
The first step in methodology is
to set up the assumptions that will help prepare the data, so as to "cut
up" properly.
Therefore, the spatial analysis
will be conducted according to these set of assumptions and the methodology
will reflect
the assumptions. The assumptions
are as follow.
1. The garbage trucks should
wish to proceed downhill rather than uphill for the optimal pickup time.
2. The garbage trucks should
wish to avoid the steep hills for the optimal pickup time.
3. The garbage trucks should
wish to proceed from the low garbage-output area to the heavy garbage-output
area to avoid having to carry around the heavy load.
1. The slope of the area
2. The elevation of the area
3. The zoning of the area
4. The accessibility of the
road of the area.
Detail
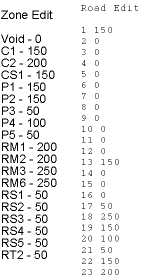
The road and zoning in the data
were very detailed (respectively 21 and 19 different categories) and
had to be subdivided into five
categories and given appropriate values ranging from 0 to 250.
Because of the nature of the analysis,
I realized at the onset that Boolean model would not be too suitable
for this particular undertaking.
As a result, I went through the additional part of the MCE exercise to
find
more suitable method of analysis
and found the Weighted Linear Comparision method more fitting.
In the first half of the analysis,
each category was analyzed and modified according to the set assumptions
and the criteria.
The Zone and Road layer had to
be reclassified to eliminate the residual value of -9999 as the minimum
value, then
were assigned to the new set value
which ranged from 0 to 250. Each layer of data was determined to have the
value
between 0 to 250, with 0 being
the void value, 50 as the most accessibility road/least garbage output
and
250 as the lowest accessibility/garbage
output.
The Zone/Road edit value

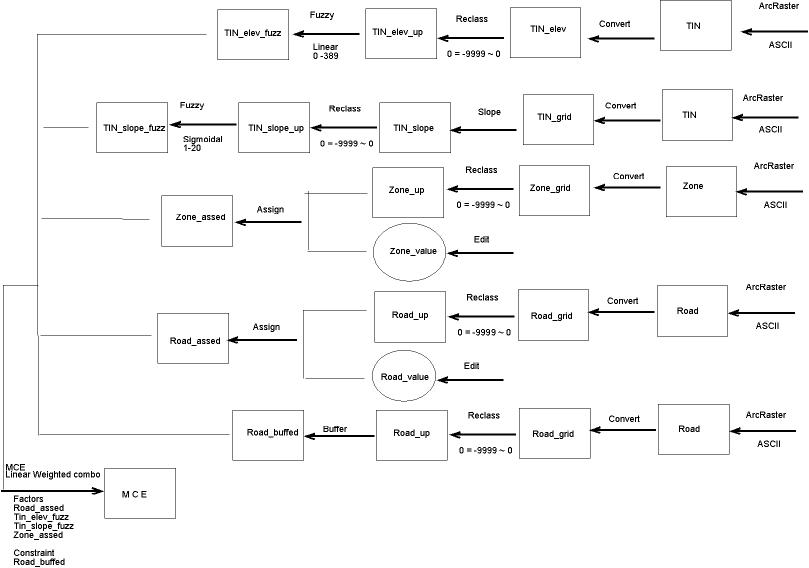
The first half of the cartographic model
The elevation model and the slope model had to go through
the "FUZZY" process because the "FUZZY" function is
well-suited to evaluates the continuous data while at
the same time allows more flexible data examination. The elevation model
was conducted in "linear function" because of the relative
even elevation. The slope, on the other hand utilized the sigmoidal function
it is obvious that after certain angle, the difficulty
would rise up disproportionately.
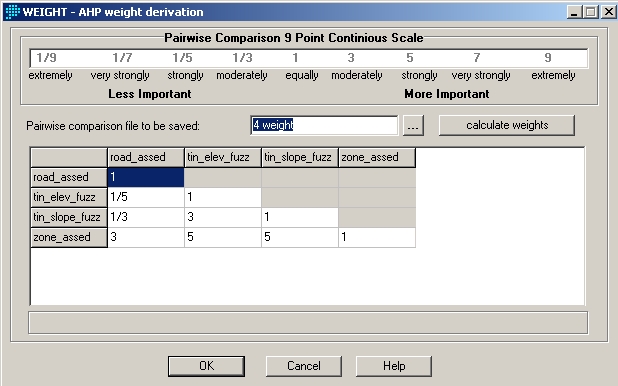
Then the evaluated data were gathered up to weigh their
respective importance using the fuction "WEIGHT".
The "Weight" function permits to evaluate the categories
based on their relative importance. This was somewhat subjective reading
of the categorical importance, which would have allowed the entrace of
biases. In my case, I judged the elevation as the least importance and
the zone as the most importance.

The outcome of this was applied to the MCE Weighted Linear
Comparison in the following procedure.
The four factors were the original categories and "Road_buffed"
was used to masks out the factors.
Full Cartographic model

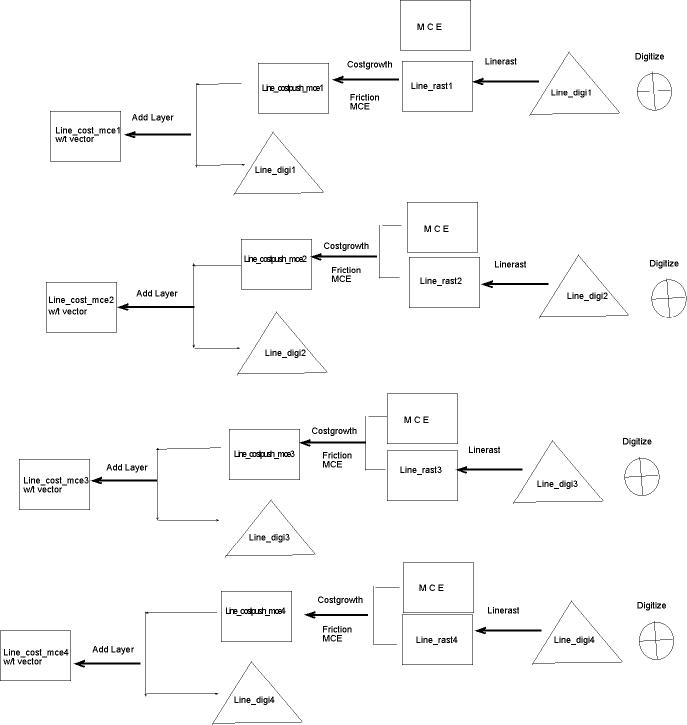
The second part of the analysis
In the second half of the analysis, I drew up the four different routes
in the area to compare the route coverage.
The purpose of this was to find the road route with the most coverage
area. I picked the four most accessible road in the area
and conducted the "COSTDISTANCE ANALYSIS" of the each route, after
which I was able to visually inspect each result.
The resulting images are posted on the Spatial Analysis page.
