| Spatial Analysis |
5.1 Images Involved in Boolean MCE
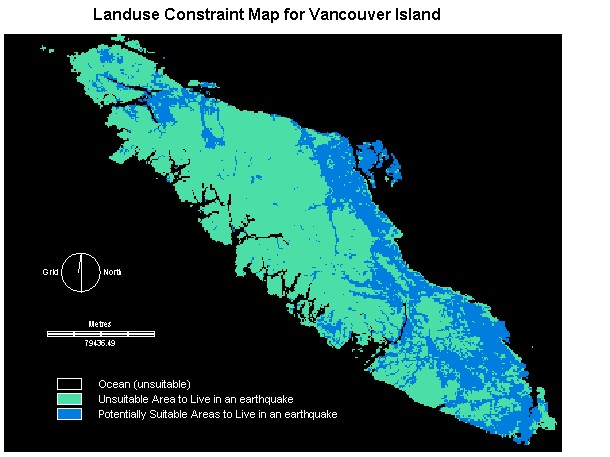
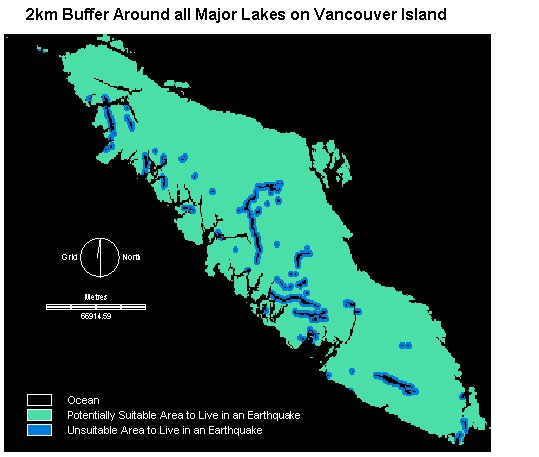
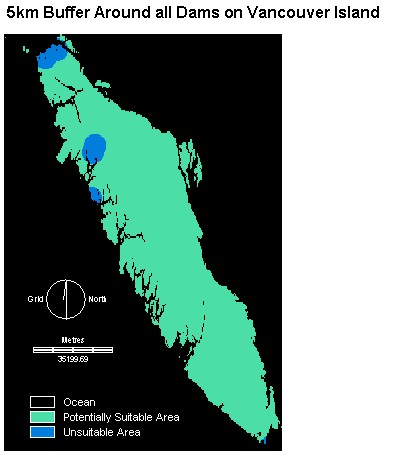
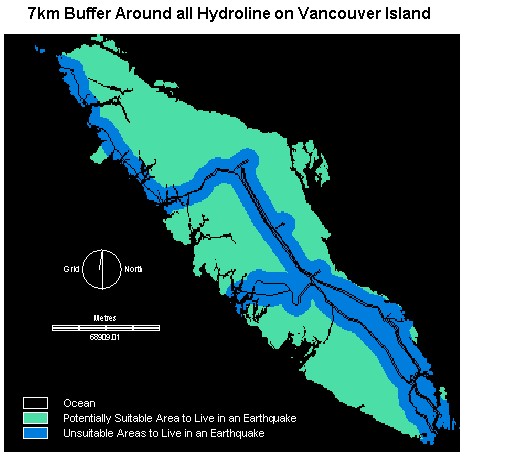
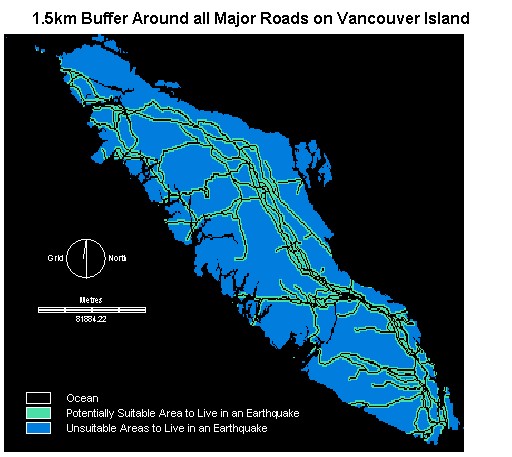
In all of the images below, the areas marked out in the colour green represent potentially suitable (safe) areas to live on Vancouver Island during an earthquake, whereas the blue areas are unsuitable (unsafe), and the black represents the ocean which is also unsuitable for obvious reasons.
Constraints:
For the Landuse Constraint Map, the areas considered suitable to live in
during an earthquake were Immature forest, Barren lands, Urban areas, Estuaries,
Agricultural lands, and Recreational areas. The areas considered
unsuitable included Ocean (flooding), Mature forest (potential forest fires
or collapse of trees on property), Logged areas, Wetlands (sinkholes created
under house when ground becomes water saturated and collapses), Lakes (flooding),
Unknown, Alpine, and Ice fields (flooding).
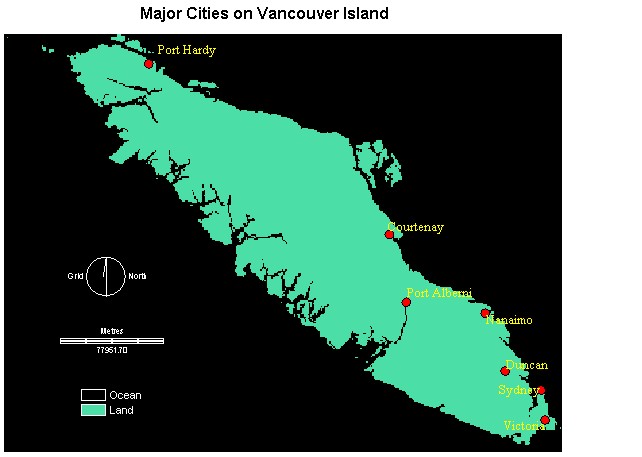
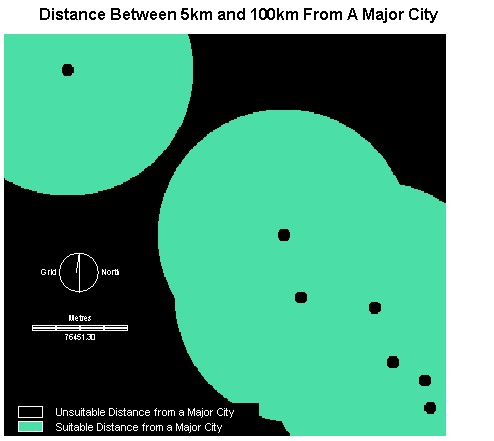
In order to perform a buffer to show the suitable distance to live from a populated city I first had to digitize in the locations and names of the seven major cities included in my analysis from a road map of Vancouver Island. With this information intact, I decided that a safe distance away from major cities would be 5km, and beyond 100km this would be too distant from a city making traveling inconvenient and more expensive. I reclassed the information to the above criteria and produced the following image.
 |
 |
|
|
Cartographic
Model for hydrlinebuffbool2
Cartographic
Model for allroadsbuffbool2
Cartographic
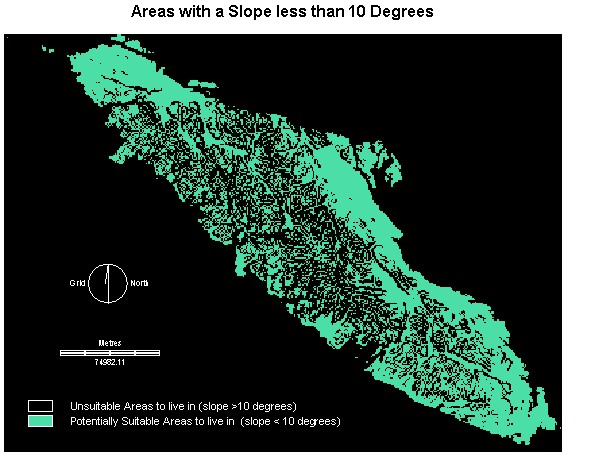
Model for slopebool
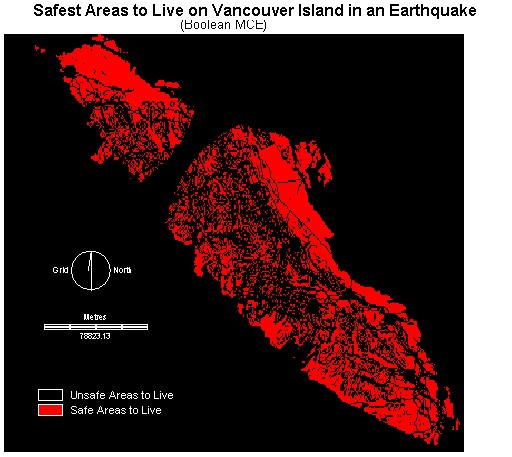
This is the final image produced with the Boolean MCE operation to illustrate the safest overall locations to live on Vancouver Island in the event of a major earthquake. The area near the northern end of the island where there is a solid black stripe across the island is a very unsafe location to live because there are major hydrolines in this area as well as a relatively steep slope and the presence of several dams. These areas were heavily buffered around, which is why the entire area appears unsafe. As you can see, with this method, all of the factors and constraints are considered to equally influence the suitability of an area, however this is not the case in real life. Some factors have a greater significance than others when it comes to safety. For example, distance from hydrolines is much more important than distance from roads and therefore it should be assigned a heavy weight. Although it is more beneficial to live near a road during an earthquake, your safety is dependent on being distant from a hydroline due to the very severe electrical currents. The different levels of significance between factors will be examined using the weighted linear combination in the second analysis.