|
None of the data that was obtained
was in a "ready-to-go" format. Some of it was in ArcView shapefile format,
which needed to be converted to Idrisi32. Other data had to be converted
from vector to raster. In all cases, there was manipulation os data (i.e.
RECLASSifying, OVERLAYing, &c).
This section will detail the
manipulation I carried out upon the data. I have divided the section up
according to each individual dataset.
The following are the datasets
I had to work with. Clicking on each will jump you to that particular
section.
| Data
Required |
How
the Data was Obtained |
| Map
of New Westminster in Idrisi32 format. |
A map of the municipalities
in the GVRD was found on the lab network server. It required some
manipulation to isolate only New Westminter. |
|
|
Using the same street
grid shapefile as was used for the bus stop digitization, I manually
created achool map in ArcView. Addresses of the schools were obtained
from the School
District website. I then added the areas for the four residential
associations that surround the schools, using information found
on the City
of New Westminster website. |
| Map with
the locations of bus stops in the target area. |
I was able to find bus
routes for Vancouver and Burnaby in the GVRD dataset on the network
server, but nothing for Westminster. Therefore, I had to digitize
my own data. I had an ArcView shapefile of the GVRD street layout;
using this as a guide and, using information from the TransLink
website, I manually digitized the bus stops in ArcView.
|
| Landuse
information. |
A landuse
map for municipalities in the GVRD was found in the Idrisi32-format
GVRD dataset on the lab server. It required manipulation
to (a) narrow it down to parks and undeveloped land, and (b) make
the data specific only to New Westminster. |
| Landuse
information. |
A landuse map for municipalities
in the GVRD was found in the Idrisi32-format GVRD dataset on the
lab server. It required manipulation to (a)
narrow it down to industrial land, and (b) make the data specific
only to New Westminster. |
Map
of New Westminster in Idrisi32 Format
I needed to start with a base
map showing only New Westminster. I found a map of the GVRD on the lab
server (\\SIS_DATA@NetAdmin@GIS\355-data\Data\gvrd\gen\CITY.*). Each
municipality was coded as having a unique value; New Westminster was
assigned the value of 16.
In order to isolate New Westminster,
I needed to use the following modules: EDIT and ASSIGN. First, I used
EDIT to create the file newwest.avl. The contents are very simple:
16
1
Next, I used ASSIGN to revalue
the CITY map. Passing the newwest.avl value file through ASSIGN to the
CITY layer produced the following map:
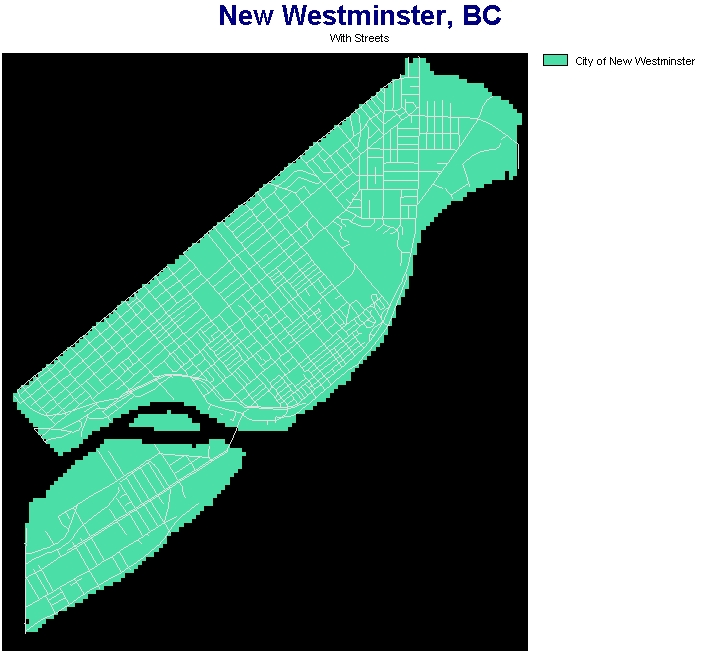
Figure 2: The ASSIGNed map of New Westminster, with a road layer added
for reference.
(NEW_WESTMINSTER)
The relevant portion
of the cartographic model for this section can be viewed here.
Return
to top.
Map
with the catchment areas for the elementary schools
The next map that needed to be created was a
map of the catchment areas for the four elementary schools that will
feed the new middle school. These elementary schools are:
- Connaught Heights Elementary
- Lord Tweedsmuir Elementary
- Lord Kelvin Elementary
- John Robson Elementary
This map had to be manually created, as no existing
available. Using the New Westminster base map
and the street layer as a guide, I manually digitized the schools in
ArcView, and used FME Universal Translator (FME UT) to convert the file
to Idrisi32 vector format. Finally, I used the POLYRAS module to convert
the vector layer into raster.
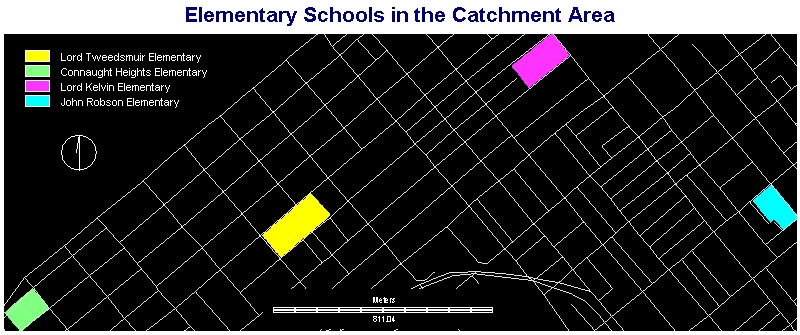
Figure 3: The four elementary schools.
(SCHOOLS)
I then added polygons for
the four residential areas that surround the elementary schools. This
information was found on the City
of New Westmisnter website. FME UT and POLYRAS was again used to
bring the shapefile into Idrisi32.
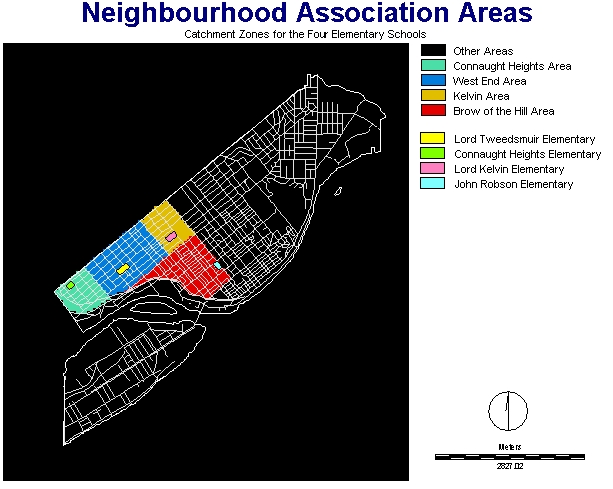
Figure 4: The four neighbourhoos association areas that surround the
four elementary schools.
(NEIGHBOURHOOD_AREAS)
The relevant portion
of the cartographic model for this section can be viewed here.
Return
to top.
Map
with bus stops in the catchment area
As one of my criteria was that
the site must be within 150 meters of a bus stop, I needed a map with...
bus stops. I found bus route data for Vancouver and Burnaby on the lab
server, but nothing existed for New Westminster. I therefore needed
to digitize the bus stops. Using the TransLink
website, I compiled a list of all the bus stops in the area that
stopped at a SkyTrain station. I then digitized the 30 points in ArcView,
using the street shapefile as a guide. I finally used FME UT and POINTRAS
to bring the information into Idrisi32 as raster format.
The resulting map is shown
below:
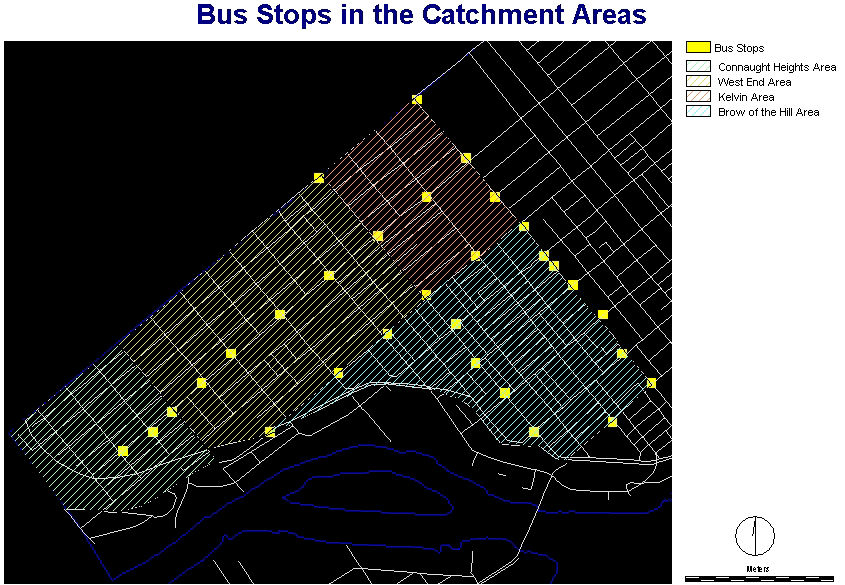
Figure 6: Map of the bus stops in the catchment area.
(NEW_WESTMINSTER)
The relevant
portion of the cartographic model for this section can be viewed here.
Return
to top.
Landuse
Information
The GVRD Landuse map from the
lab server was already in Idrisi32 raster format, so no additional manipulation
was required, except for that required for later spatial
analysis. That aspect will be documented later.
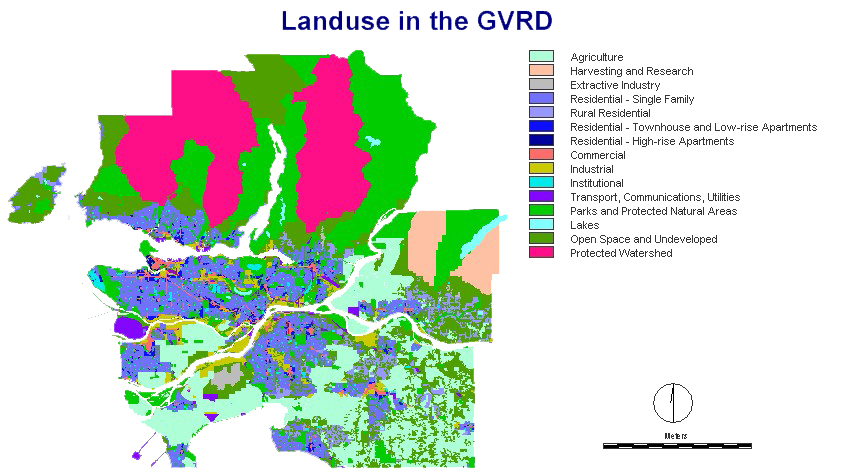
Figure 7: Landuse in the GVRD
(LANDUSE)
Next stop: Spatial
Analysis!

|

