|
Now that the data has been collected and manipulated, the final analysis
can begin. As I am using MCE for this project, I need to create a series
of boolean images - one for each of my criteria. To recap the criteria:
- The site must be located inside the catchment area
for the four elementary schools that feed into it.
- The site must be located no more than 150 m from
a bus stop. The bus must also connect to a SkyTrain station.
- The site must be on unoccupied land or parkland.
(The parkland criteria was the one "predetermined" criteria - the option
was already in the public domain.)
- The site must be at least 650 m from industrial land.
Within the City of New Westminster
The image for this criteria already exists in the NEWWESTMINSTER layer
I used as the base map.
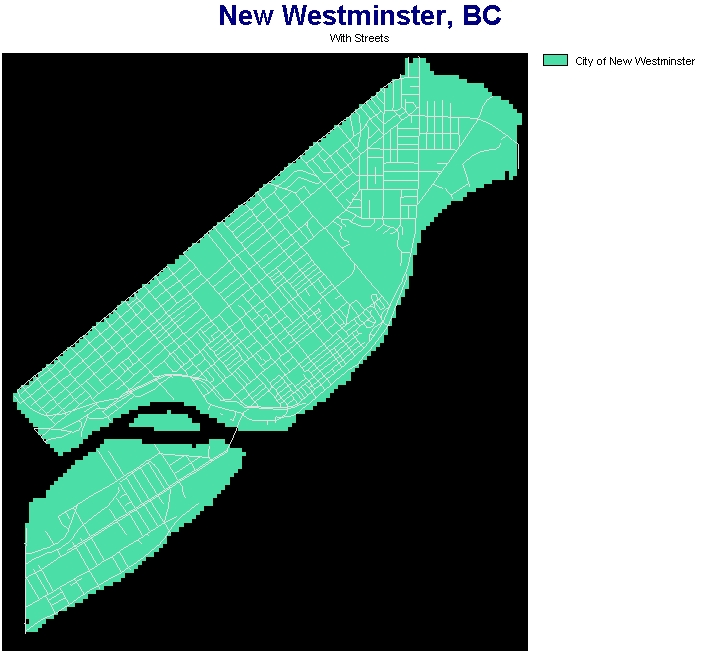
Figure 8: New Westminster
Back to top.
Located in the Catchment Area for the Four Schools
I used EDIT, ASSIGN, and the NEIGHBOURHOOD_AREAS map created earlier
to create a boolean map of the catchment area.
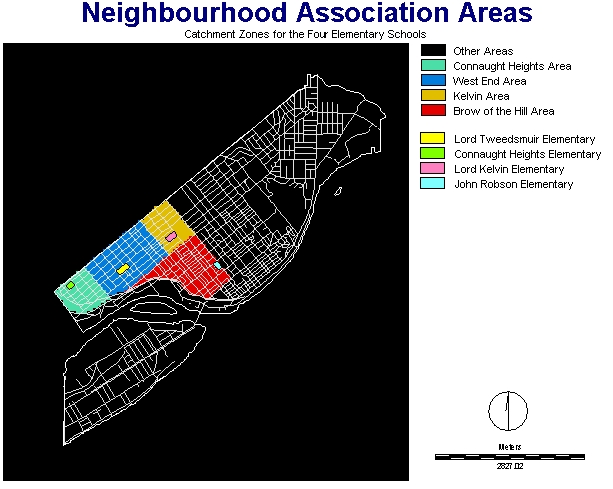
Figure 9: The four separate catchment areas.
(NEIGHBOURHOOD_AREAS)
The first step was to use EDIT to create a value file called areas.avl.
It contained the following values:
1 1
2 1
3 1
4 1
When this value
file was run through ASSIGN to the NEIGHBOURHOOD_AREAS file, the following
boolean map was created:
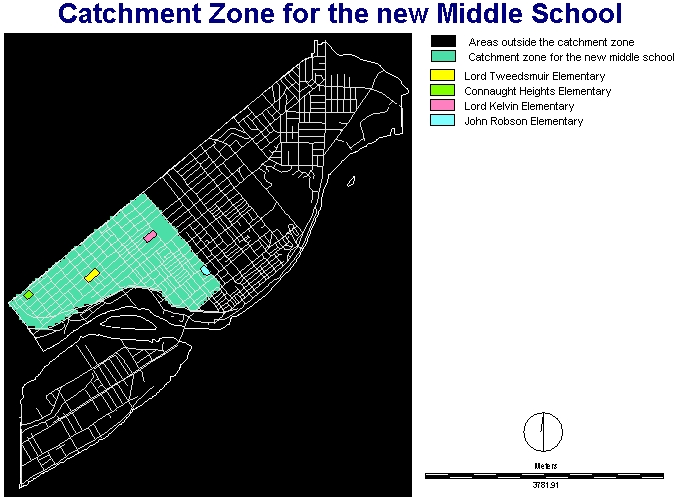
Figure 10: Catchment zone for the new Middle School
(CATCHMENT_BOOL)
Back to top.
Must be Within 250 Meters of a Bus Stop
Creating this boolean map requires use of the BUFFER operation. I already
had the bus stop locations digitized:
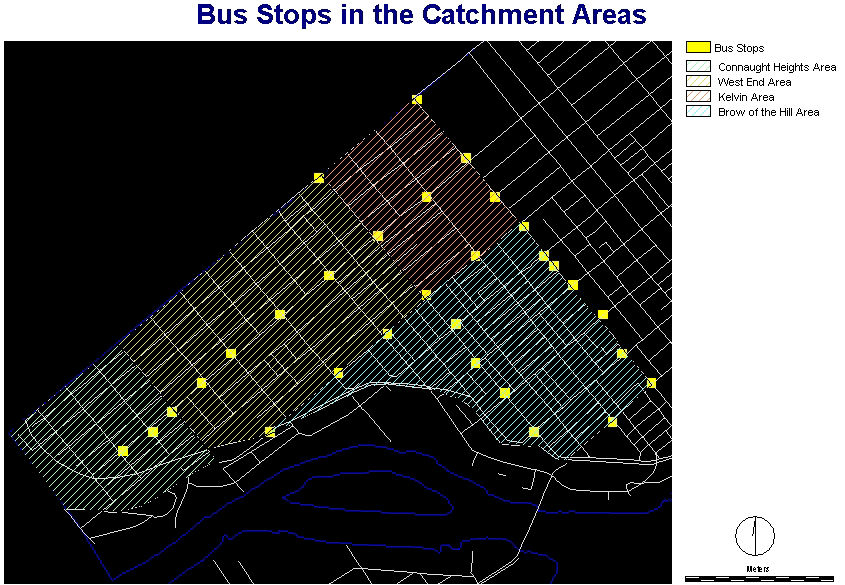
Figure 11: Bus stops in the catchment areas
(BUS_STOPS)
Using the BUFFER operation, I specified that I wanted a layer that
used BUS_STOPS as the reference layer, and assigned a value of 1 to
areas within 150 m of a bus stop and a value of 0 to areas outside that
150 m window. The result was the following map:
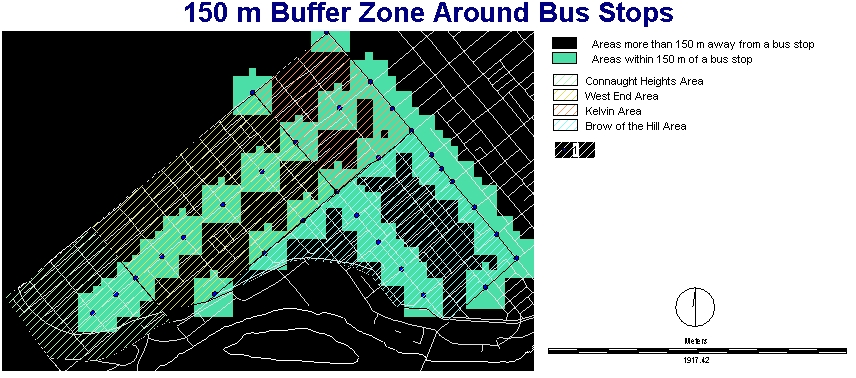
Figure 12: 150 m buffer zone aroun bus stops
(BUS_BOOL)
Back to top.
Must be on unoccupied land or parkland
I already had landuse data for the GVRD. This map showed all types
of landuse, for all municipalities in the Regional District.
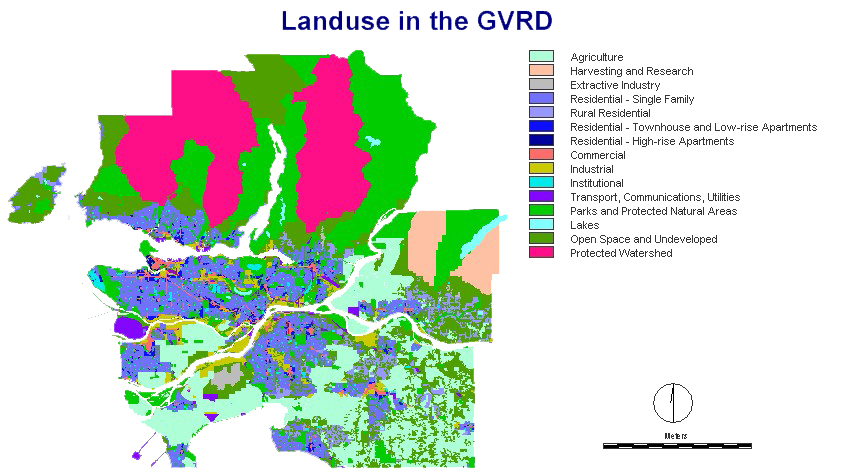
Figure 12: Landuse in the GVRD
(LANDUSE)
Narrowing this down to unoccupied land or parkland in the GVRD required
two steps: 1) creating a map that only showed park- and unoccupied land,
and 2) restricting this only to New Westmisnter.
The first step required the use of EDIT and ASSIGN. I used EDIT to
create a attribute value list that classified both parkland and unoccupied
land to have a value of 1:
12 1
14 1
Running this value list and the LANDUSE map through ASSIGN created
the following boolean map:
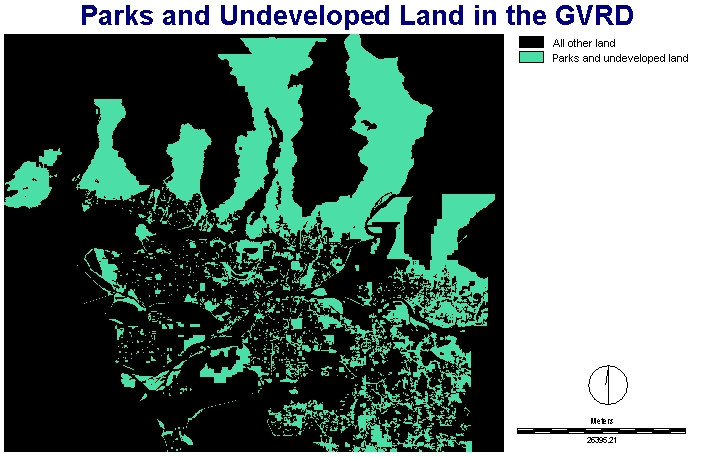
Figure 13: Parks and Undeveloped Land in the GVRD
(GVRD_PARKS_UNDEVELOPED)
To limit this to land in New Westminster, I used OVERLAY
to multiply the GVRD_PARKS_UNDEVELOPED and NEWWESTMISNTER layers.
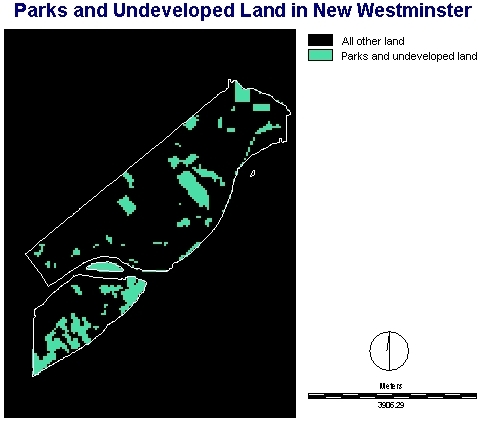
Figure 14: Parks and Undeveloped Land in New Westmisnter
(NEWWEST_PARKS_UNDEVELOPED)
Back to top.
Must be at least 650 meters from industrial land
The procedure for this map is very similar to the one above. EDIT and
ASSIGN were used in conjunction with the LANDUSE map to create GVRD_INDUSTRIAL.
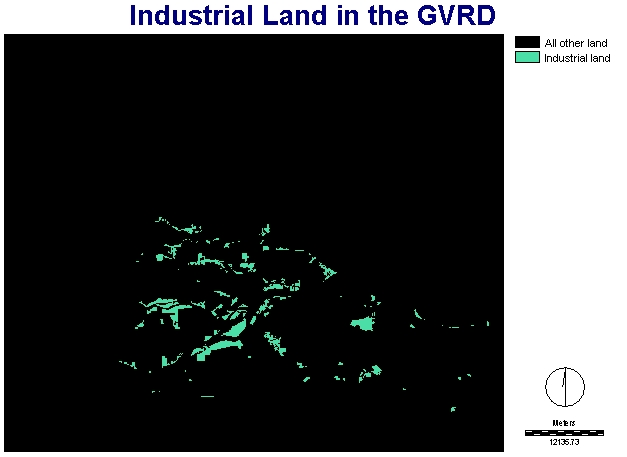
Figure 15: Industrial land in the GVRD
(GVRD_INDUSTRIAL)
OVERLAY was used to multiply GVRD_INSUSTRIAL and NEWWESTMISNTER
to create the NEWWEST_INDUSTRIAL boolean map:
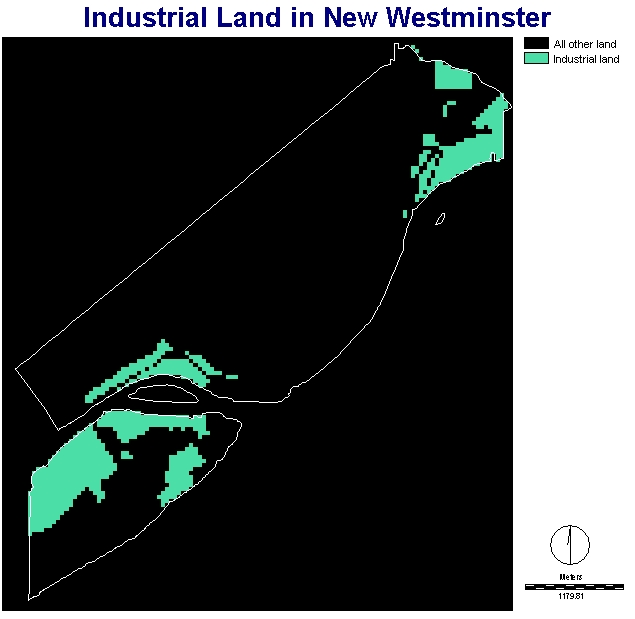
Figure 16: Industrial land in the GVRD
(NEWWEST_INDUSTRIAL)
Finally, BUFFER was used to assign a value of 1 to locations
that were 650 meters of more away from industrial land, and 0 to areas
within 650 m.
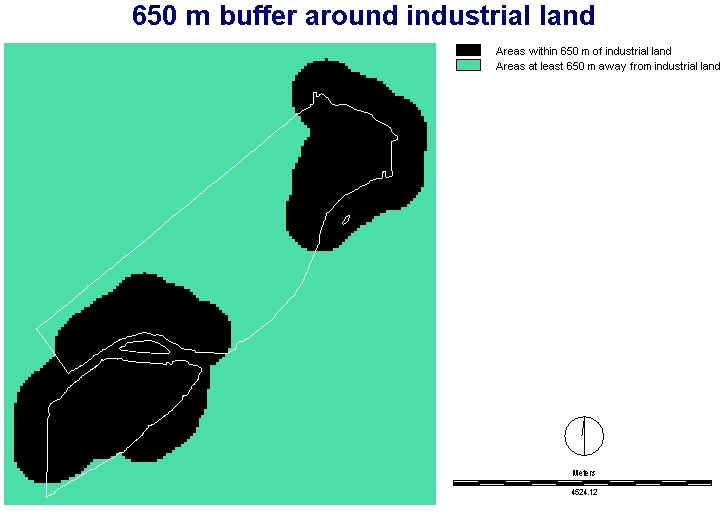
Figure 17: 650 m buffer around industrial land
(IND_BOOL)
Back to top.
Now that these five boolean maps are available, the final analysis can
begin. MCE was used to provide the final map of possible locations. MCE
takes a set of boolean images and adds them. Only areas that are classed
as 1 on every map will show up as 1 on the final map. The process looks
like this:
CATCHMENT_BOOL + BUS_BOOL + NEWWEST_PARKS_UNDEVELOPED
+ NEWWEST_INDUSTRIAL + NEWWESTMISNTER = SITE_CANDIDATES
THE FINAL MAPS:
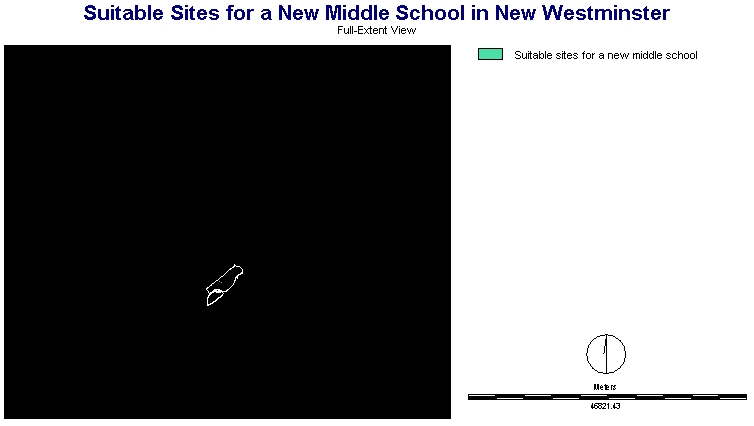
Figure 18: Suitable Sites for a New Middle School in New Westminster (Full-Extent
View)
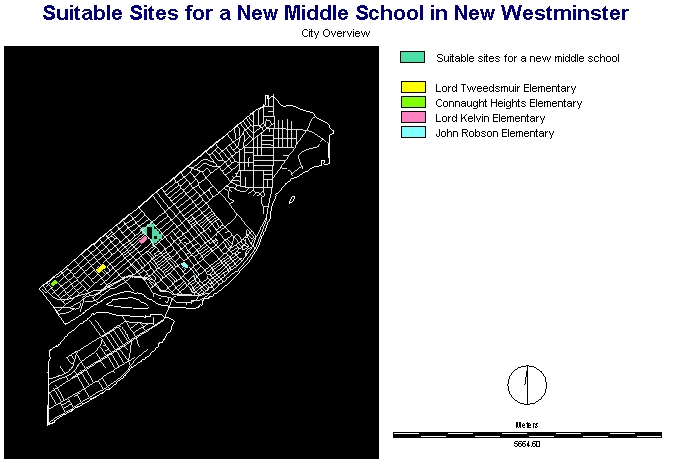
Figure 19: Suitable Sites for a New Middle School in New Westminster (Citywide
Overview)
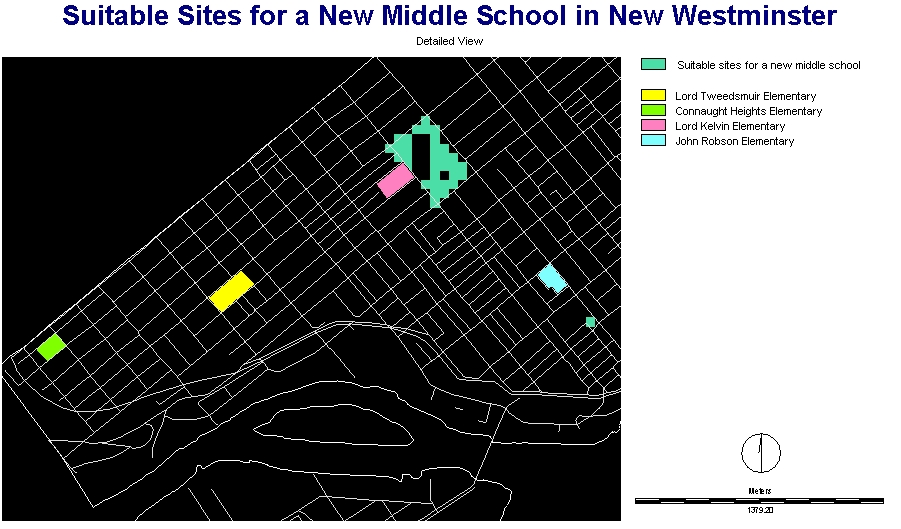
Figure 20: Suitable Sites for a New Middle School in New Westminster (Detailed
View)
View the Cartographic Model
PDF
| JPEG
Summary
The final result is quite interesting. The large green area east of
Lord Kelvin Elementary School (pink) is Moody Park, one of the larger
parks in New Westmisnter. This park was one of the sites that the School
District was contemplating using for the new Middle School. It was only
after a large public outcry over the loss of parkland that the District
backed away from this idea, at least for the time being.
Given that I did not contact the District for their criteria, it is
obvious that they used a very similar process as the one I used to determine
their sites. Perhaps they even used Idrisi32 :-)
The smaller green area south of John Robson Elementary is most likely
an anomoly. I visited the site (about 5 minutes from home) and observed
that it is a concrete plaza in downtown New Westminster called Hyack
Square. It has a Parks Department sign; I presume that the GVRD landuse
map has that area classified as parkland.

|

