Part Three:
Restricted and Recreation Areas
Original data for areas prone to flooding was
downloaded in ARCinfo (.E00) format. The data was then converted into a
.mdb file for viewing in ArcView. The .mdb files were converted to shapefiles
(.shp). The data was finally converted from shapefile format using IMPORT;
Software-Specific Formats; SHAPEIDR into Idrisi Vector format (.VDC). The
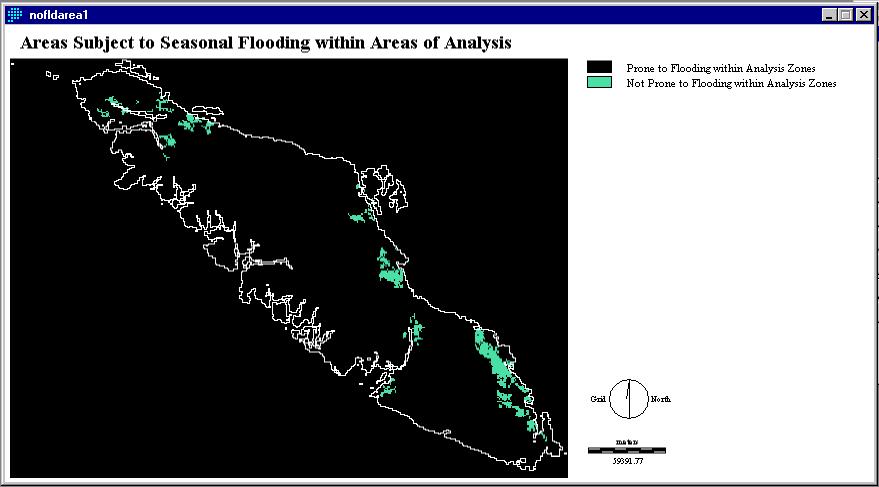
data on flooded areas was rasterized, and reclassed for use in an OVERLAY
(multiply) with a reclassed image of SLOPECAMP (fig. 7), called BIG_AREA.
The image produced from the multiply OVERLAY is NOFLDAREA1 (reclassed for
use in future overlays), figure 8.
Fig. 8
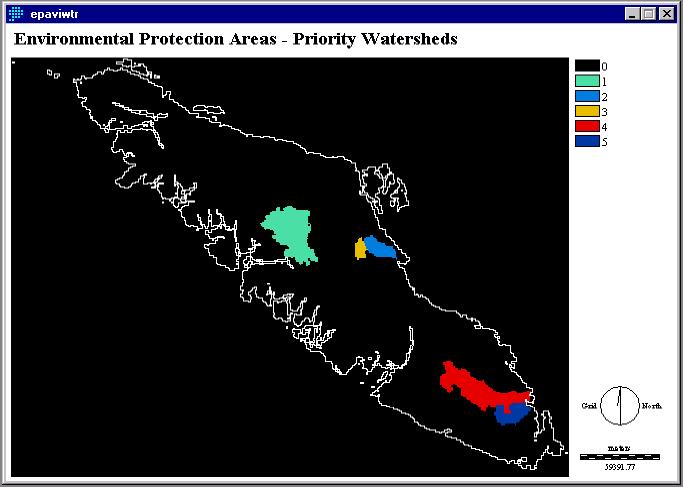
It would be irresponsible and detrimental to the environment if people entered an environmental protection area. These areas will be avoided in this analysis. Data for priority watersheds is found in the illustration below (fig. 9). To permit analysis, this layer was reclassed so all values possessed the value of one.
Fig. 9
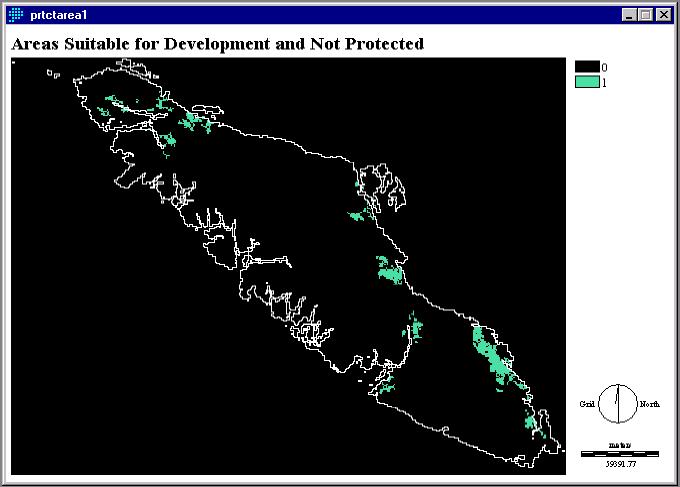
OVERLAY (subtract) joined NOFLDAREA1 (fig. 8) and RECLASSEPA, and then RECLASS was operated to derive the image below, PRTCTAREA1 (fig. 10). This image includes the sites that are within NOFLDAREA1 but excludes areas that are protected watersheds (RECLASSEPA).
Fig. 10
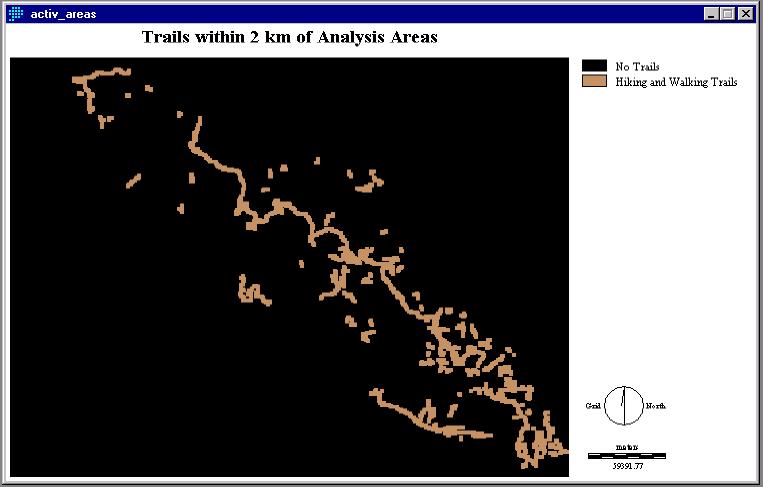
Besides fishing, popular recreation activities in and around campgrounds are hiking and walking. Vancouver Island contains many trails that permit these activities. For the following analysis, HIKING and WALKING data was converted in the same fashion as the flood zones described earlier. These two layers were overlain using the OVERLAY (addition) operation. The image was then reclassed to create the image, ACTIV_AREAS (fig. 11) below.
Fig. 11
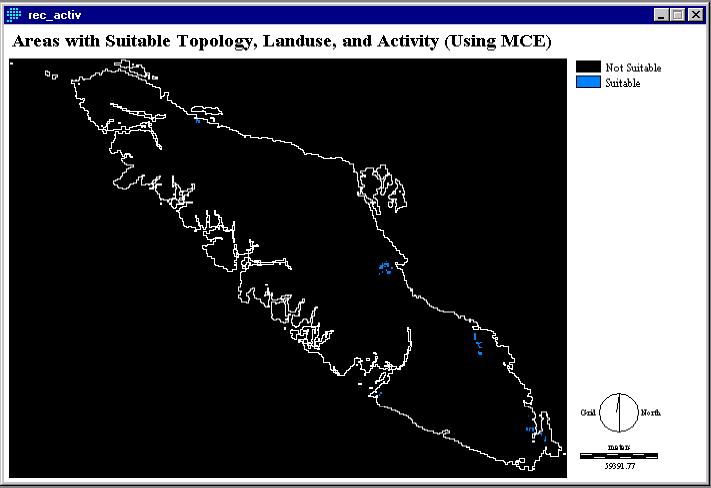
A MULTI-CRITERIA EVALUATION (MCE) was performed to produce the image below (REC_ACTIV, fig. 12). A Boolean operation combined SLOPECAMP (fig. 7), NOFLDAREA, PRTCTAREA1 (fig. 10), and ACTIV_AREAS (fig. 11) in an OVERLAY. This layer has combined all previous operations and procedures to produce several areas that would be suitable for development and use as a campsite. To perform further operations for analysis, we need to ensure that these suitable areas are still large enough to carry a campsite. REC_ACTIV was GROUPed with diagonals, AREA was determined, and then RECLASSed (keeping areas 2-400 km2) to keep areas that were larger than 2 km2. This image was called CAMPS.
Fig. 12