Results
Results obtained by implementing the devised methodology.

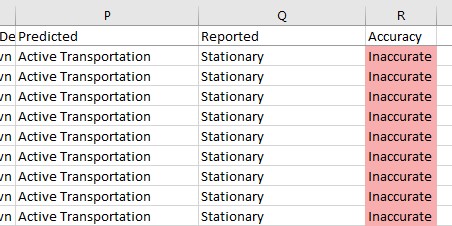
An example of the kind of results obtained via our methodology for activity prediction, as well as our methodology for validating the accuracy of activity predictions, can be found in Figure 4 which showcases the "Predicted," "Reported," and "Accuracy" columns.

In terms of summary statistics, Graph 1 is a bar graph that shows the accuracy of predicted activity, based on accelerometer and GPS data, using the reclassified "TripMode" data for validation. 1,078,286 entries were accurately classified by our activity prediction formula. A significantly lower 458,389 entries were inaccurately classified by our activity prediction formula. Due to a value of "unknown" in the "TripMode" column of the data we received, 2,172,857 entries have an unknown accuracy.

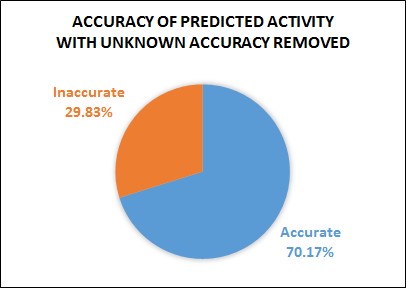
Furthermore, Graph 2 is a pie chart that shows the accuracy of predicted activity with the value of "Unknown" removed. It shows that only 29.83% of entries with an accuracy value besides "Unknown" were inaccurately classified by our activity prediction formula. An astounding 70.17% of entries with an accuracy values besides "Unknown" were accurately classified by our activity prediction formula.

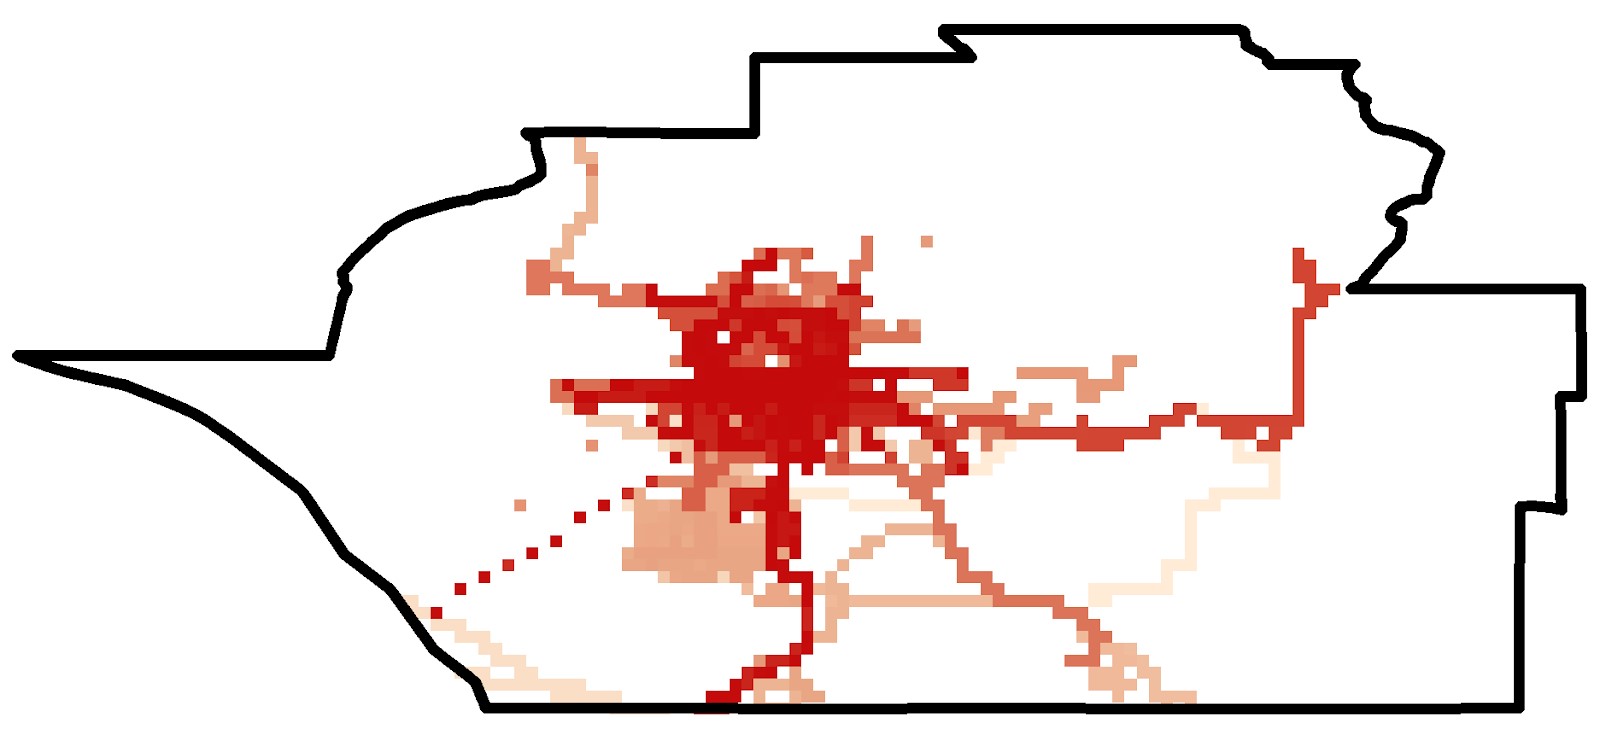
The map of Metro Vancouver showcasing rasterized location data of study participants is found in Figure 5. Darker pixels in the image reflect an increased density of location data.


