Home | Introduction | Data and Methods | Results | Potential Errors | References
Data and Methods
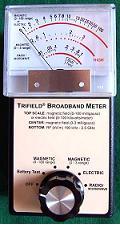
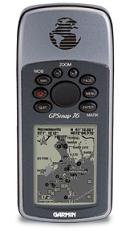
EMF data was collected throughout SFU campus using a Trifield Broadband Meter, the extended sensitivity version. The meter was set on the magnetic field setting for 0 – 3 milligauss unless the reading was higher, in which case the 1 –100 milligauss range was used. 123 points were randomly chosen based on where student and faculty are located around campus both inside buildings and outside. Latitude and longitude, in decimal degrees, was also taken at each point location using GARMIN GPSmap 76 in order to get a geographic position of each location EMF measured. Geographic positions had an accuracy ranging from 6 to 16 meters depending on proximity to buildings and amount of cloud cover on the days measurements were taken. For locations indoors, a geographic position was taken at the closest location outdoors since the GPS meter could not be used inside.


Trifield Broadband Meter
GARMIN GPSmap 76
(http://www.orgonelab.org/cart/ytrifield.htm) (https://buy.garmin.com/shop/shop.do?pID=169#)
The SFU aerial photograph used to overlay EMF points in ArcMap was taken in 2004 and has a resolution of 10 cm. The file was later converted to standard UTM Zone 10 NAD83 projection by Jasper Stoodley in 2005 (Stoodley, 2005). This photograph is somewhat outdated due to the recent construction of UniverCity, Art and Social Science Complex and Blusson Hall, TASC buildings, and Cornerstone. Unfortunately, this was the most recent aerial photograph available.
The EMF data in excel spreadsheet format was imported into ArcMap using ‘Add x & y data ’ function. Latitude and longitude were used as x and y and the geographic reference used was 'WGS 1984'. Once the data was in ArcMap, the EMF layer was exported as its own layer file and projected to match the aerial photograph. ‘Editor’ function was used to move EMF point locations to actual locations of measurements as some of the GPS points were not directly where EMF reading was taken and due to limited accuracy in GPS measurements. The image below shows the locations of all EMF measurements taken and was created in ArcMap.
The SFU aerial photograph was imported into Idrisi and the EMF vector file (from EMF.vlx file) was overlayed on top of it. The idrisi formate of the aerial photograph, supplied by Justin Song, had to be used because errors occured when converting it to Idrisi format from ArcMap. Using symbol workshop a point symbol file was created to place EMF values into catagories. Catagories were determined by reviewing research and information presently known about EMF.
Below shows a flow chart of the steps described above.
(c) 2008 Sheena Spencer