Methodology
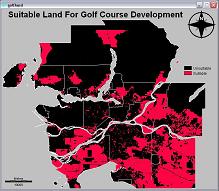
To define areas of suitability for a new golf course development certain constraints and factors needed to be taken into account. Constraints are expressed in terms of Boolean logic. Boolean logic eliminates uncertainty in decision making by separating areas to be either inside or outside of a certain range. Areas not included in the analysis are given a value of 0 while included areas are given a value 1. Factors, on the other hand, are measured on a continuous scale and allow for suitability enhancement or detraction of a specific activity. In this project, there are 2 constraints and 11 factors that all play a role.
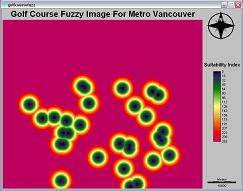
Decision Wizard - Creating Fuzzy Image
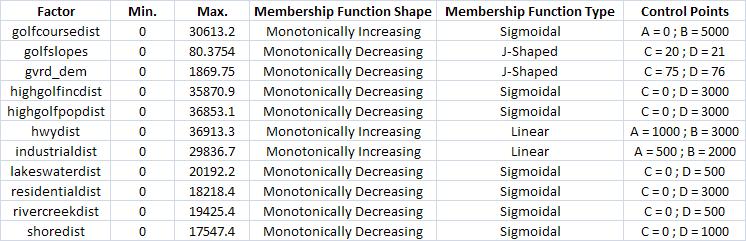
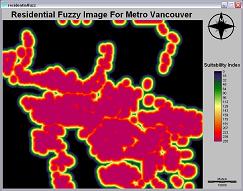
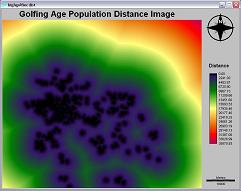
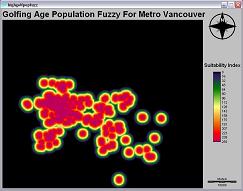
Creating "fuzzy" images allows you to convert different sets of measurements into one standardized suitability range so that comparisons between the images can be made. It takes into consideration all the factors in their distance file form. If you specify a membership function shape and type, the FUZZY module take these distance files, as well control points, and produces a “fuzzy” image. The membership function shape can be either monotonically increasing, monotonically decreasing, or symmetric. The membership function type can be either sigmoidal, j-shaped, or linear. Control points allow you to choose the values that will determine how suitability will be distribuited among the image. The image below shows the criteria for the 11 factors converted into "fuzzy" images:
Constraints (Click To Enlarge Images)
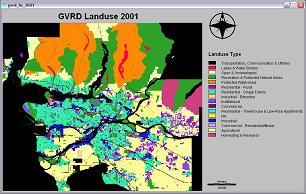
Landuse
Having landuse as a constraint is by far the most important aspect of this project. Determining what kind of land a golf course should be built on is pivotal. For example, it doesn’t make sense to build a golf course on land that is already designated as being residential. Taking this into consideration, I took the GVRD landuse file and determined that the suitable land for golf course development would be those designated as ‘open and undeveloped’ and ‘agricultural.’
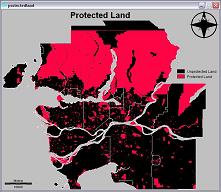
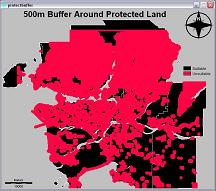
Protected Areas
This type of land was also considered to be a constraint. Although building on protected land is not an option, building close to the land could have detremental effects. This being the case, I decided that golf courses should not be built within 500m of these areas. In the landuse file, these areas are designated as Recreation & Protected Areas and Protected Watershed.

Factors (Click To Enlarge Images)
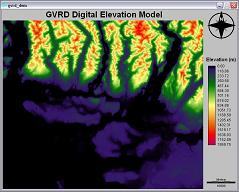
Elevation
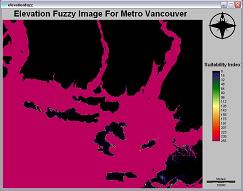
Building golf courses on elevated lands allows the golfer to take in the view of the surrounding area. In this case as elevation increases from 0m, suitability also increases until reaching an optimal height which I considered, 75m. The file GVRD_DEM was used in this instance and a FUZZY image of elevation was created for the MCE.
![]()
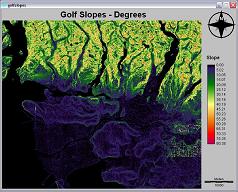
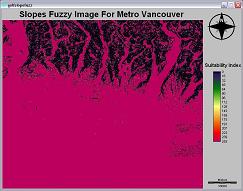
Slope
Having different slopes to contend with makes playing golf more interesting as compared to playing on a golf course built on completely flat land. Although slope is good, too much slope can make the golf course too challenging and virtually unplayable. In this case as slope increases from 0°, suitability increases until the optimal 20°. The slopes file was created from the GVRD_DEM file by the module SURFACE.
![]()
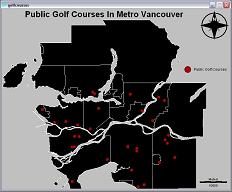
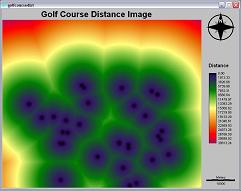
Golf Courses
You don't want to build a new golf course near any areas where there are existing golf courses. More importantly, being closer to other golf courses involves direct competition between them to attract golfers.
![]()
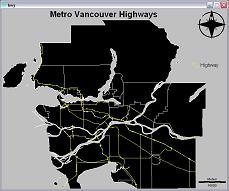
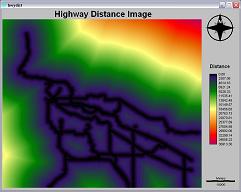
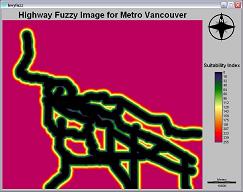
Highways
The proximity to a highway plays a role in this particular golf course development MCE in the fact that being located close to a highway is bad because of the noise that is generated from one.

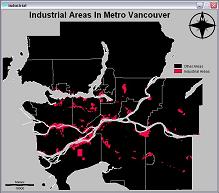
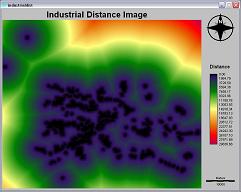
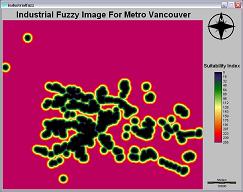
Industrial Areas
The proximity to industrial areas also plays a role in deciding where to place a golf course. This is due to the fact that industrial areas are not aesthetically pleasing. When you think about golf you think about nature and thus industrial areas can be an eyesore. Industrial Areas were isolated from the GVRD landuse file.
![]()
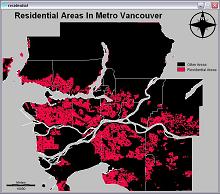
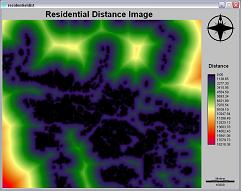
Residential Areas
Having a golf course located near residential areas can be seen as a good thing because the location could potentially attract more people.
![]()
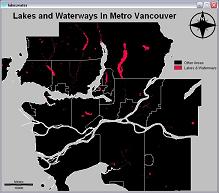
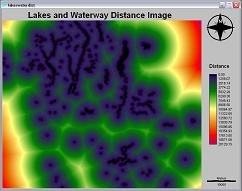
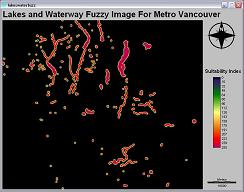
Lakes & Waterways
This particular factor plays a role in the natural beautification of a golf course. They could just be there as something to look at or can be integrated into the golf course design and used as hazards.
![]()
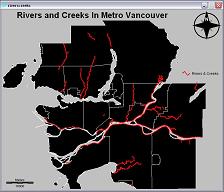
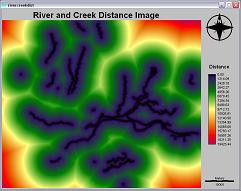
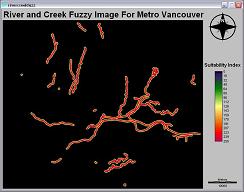
Rivers & Creeks
This particular factor plays a role in the natural beautification of a golf course. They could just be there as something to look at or can be integrated into the golf course design and used as hazards.
![]()
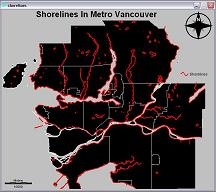
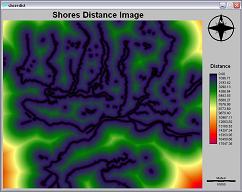
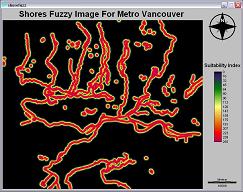
Shorelines
This particular factor plays a role in the natural beautification of a golf course. They could just be there as something to look at or can be integrated into the golf course design and used as hazards.
![]()
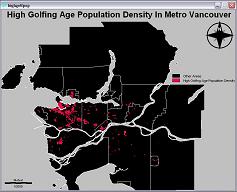
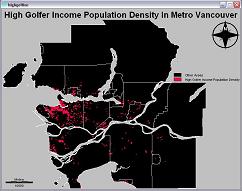
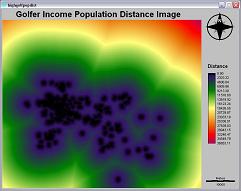
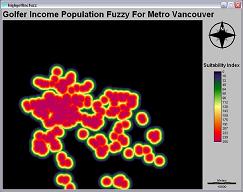
Population (Golfers Age & Income)
Using data collected from a survey of Michigan golfers, it was discovered that that most golfers were between 36 and 50 years of age (Stynes, Sun & Talhelm, 2000). A study done by Haydam & Tassiopoulos (2008), also found that golfers were between 36 and 65 years of age, with almost 40% of those between 36 and 50 years old. Taking this into consideration with the population figures obtained by Canadian census data, I found the population between 36 and 50 years of age in all the dissemination areas (DA’s) of Metro Vancouver. Then looking at a quatile distribution with 5 classifications, I took the uppermost range and labeled it as areas of high golf population density. Data collected from the same survey found that most golfers in the sample had an income of $50,000 - $65,000 (Stynes et al., 2000). Seeing that this data was collected in the year 2000, and that it was in US dollars, I calculated for inflation and then converted it into CDN dollars. The resulting incomes after the calculations were $80,000 - $120,000. Taking this into consideration with the Canadian census data, I created a map with the population of people between this income range in all the DA’s. Then looking at a quantile distribution with 5 classifications, I took the uppermost range and labeled it as golf income areas of high population density
![]()
![]()
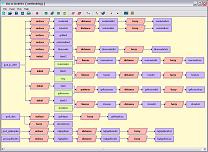
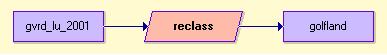
MacroModeler (Click To Enlarge Images)
Below is the entire cartographic model for all the images created above: