Methodology
In order to determine a suitable location for a nuclear power plant, a multi-criteria evaluation methodology was employed on a series of criteria to understand their spatial relationships. A series of weighted linear combination (WLC) multi-criteria analyses were performed in order to weight factors from three perspectives: the perspective of the developer of this infrastructure project, that of an environmental conservation perspective, and from a First Nations perspective. Each of the three WLC multi-criteria evaluations were then combined using the INTERSECTION (AND) boolean logic and map algebra in order to optimal site locations. The Macro Modeler is a cartographic modeling tool used in IDRISI that allows for the assembly of raster, vector and attribute value files and the manipulation of these datasets through the use of modules. The Macro Modeler was a crucial tool used in this project and is used to show the steps taken in deriving new spatial information. A least-cost pathway was also completed based on the cost distance of establishing a main power line from possible power plant sites to the existing BC Hydro electricity grid in order to augmented location suitability.
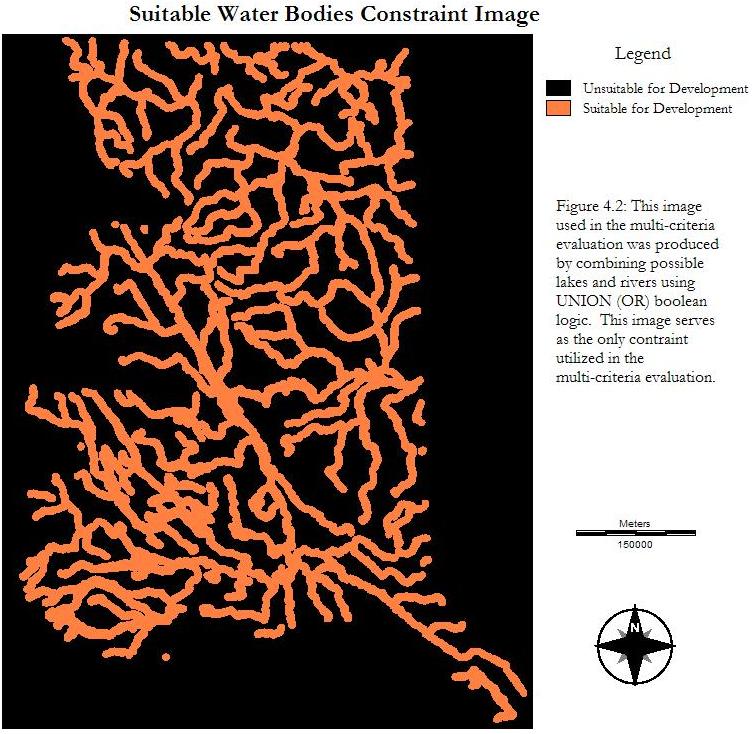
This form of multiple layered analysis focuses on determining suitability based on two forms of criteria: constraints and factors. Constraints serve to limit possible regions constituted by boolean maps which denote areas that can be developed and those areas that cannot. As a result of the necessity of viable water sources needed in the operation of nuclear power facilities, a proximity buffer of 5km around water bodies (Figure 4.1). These two boolean images were then combined using UNION (OR) boolean logic to create one constraint image (Figure 4.2).
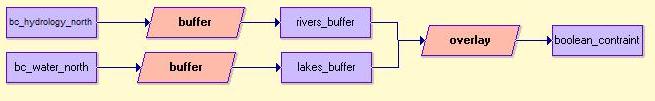
Figure 4.1: Cartographic model used to create the water bodies boolean constraint image. A 5000 metre buffer length and UNION (OR) logical expression was used to derive this image. Once the buffer images were calculated, the IDRISI's Image Calculator produced the contraint image.
As the second criteria utilized in this type of multi-criteria evaluation, factors work to enhance or detract from the suitability of the activity under observation. Therefore, factors do not simply demarcate areas of suitability or non-suitability, but rather determine the level of appropriateness based on a range of possibilities. Nine factors were investigated in this analysis, all of which were based on the distance away from the specific spatial entity except for the slopes image (BC_SLOPES). The “DISTANCE” module was used in IDRISI to perform this task calculating distances from each examined criteria. Slope percentages were derived from the DEM through the use of the module “SURFACE” in IDRISI (Figure 4.3).

Figure 4.3: Cartographic model produced using IDRISI's Macro Modeler displaying the use of "DISTANCE" modules used to produce a distance image calculating length from each spatial entity and "FUZZY" in order to create a common scaled image in preparation for layer combination. Additionally, the "SURFACE" module was derive a slopes image which was later also scaled using the "FUZZY" module.
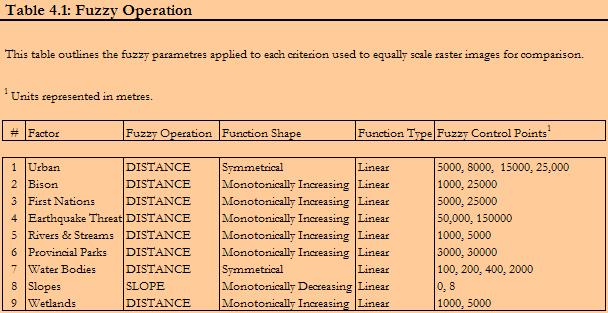
In order to examine all of these distance images together, they must be scaled into a common range so that they can be accurately compared and relationships can be derived. This was carried out using IDRISI’s “FUZZY” module which standardized all of the factors examined into a 256 value range from 0 to 255 (0 being the lowest suitability and 255 being the highest). Symmetrical and monotonic membership function shapes and linear membership function types were the defined parameters utilized when running the “FUZZY” operation. There are two (in the case of monotonic shapes) or four (in the case of symmetrical shapes) control points which are used to delinate starting and ending points of the image based on the function shape. Table 4.1 outlines the parameters used in calculating the fuzzy images for each criterion.