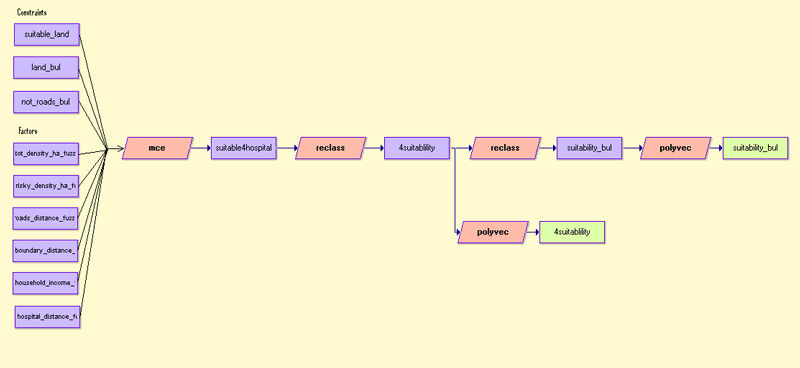

For total density, a monotonically increasing linear function was used, because higher densities meant higher levels of suitability. Since I felt that density over 20 persons/ha reached the maximum level of suitability, I used 20 as my control point. Same logic was used for the “At Risk” population density, but because the numbers were naturally lower, the suitability reached its maximum value at 8 persons/ha.
The suitability decreased away from the road network; therefore a monotonically decreasing linear function was used to create the levels of suitability for various areas of Vancouver.
As we moved inwards, away from the boundary edges, the suitability increased. For this I used the monotonically increasing sigmoidal function, because it offered a gradual transition between areas of 0 and 255 level of suitability. I set the first control point at 20, because I felt that areas closer than that had low suitability.
As household income increased, the suitability for a new hospital decreased. A monotonically decreasing J-shaped function was used to show this relationship. To place more importance on the households with less than $30 000 income, a control point was set at this level.
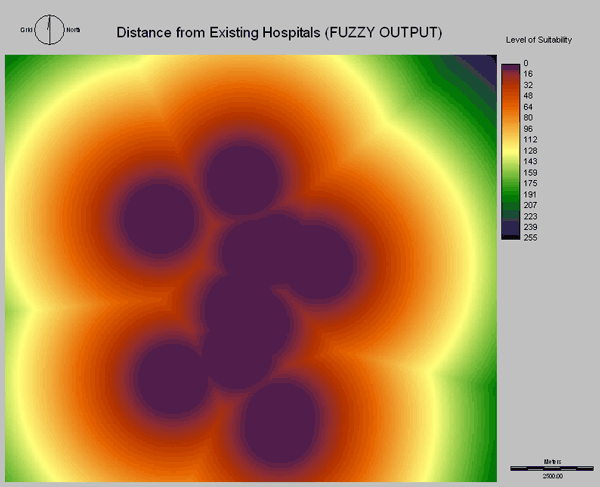
With increasing distance to an existing hospital, the suitability monotonically increased in a linear fashion. The control point c was set at 1000m, to further stress the importance of a 1km buffer zone around existing hospitals, where a new hospital should likely not be placed.
Below are maps created using the FUZZY module of the Decision Wizard.
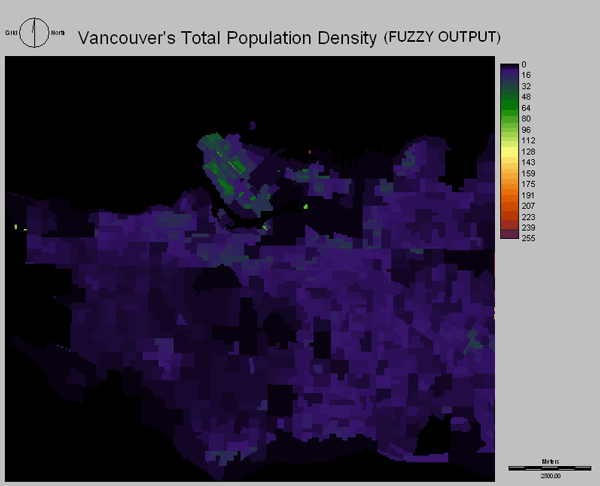
Above is the Fuzzy Output of the Total Population Density.
![]()
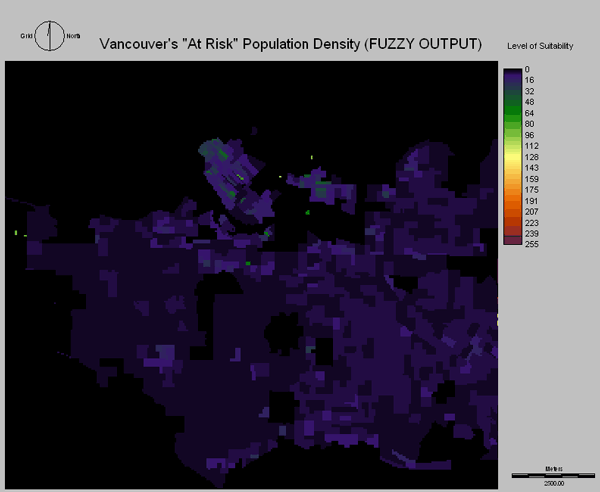
Above is the Fuzzy Output of the "At Risk" Population Density (ages under 5 , or 55+).
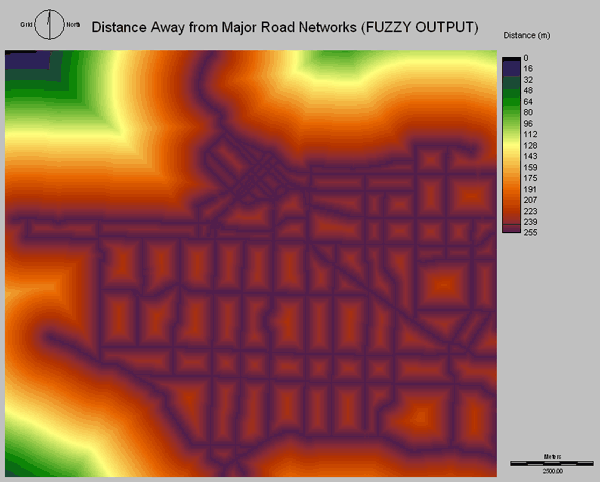
Above is the Fuzzy Output of the Distance of the Road Network.
![]()
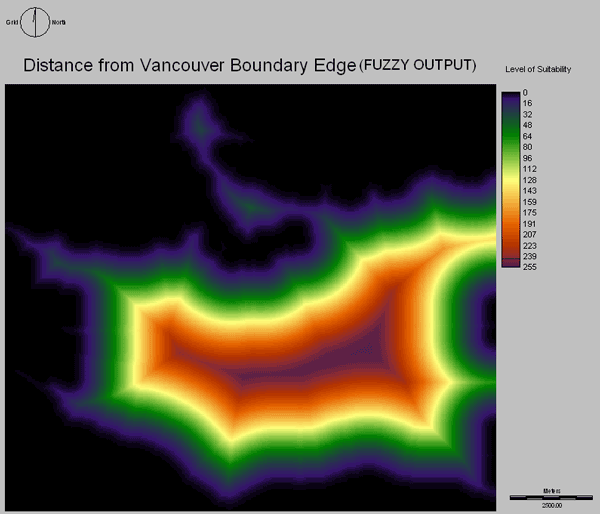
Above is the Fuzzy Output of the Vancouver Boundary Edge.
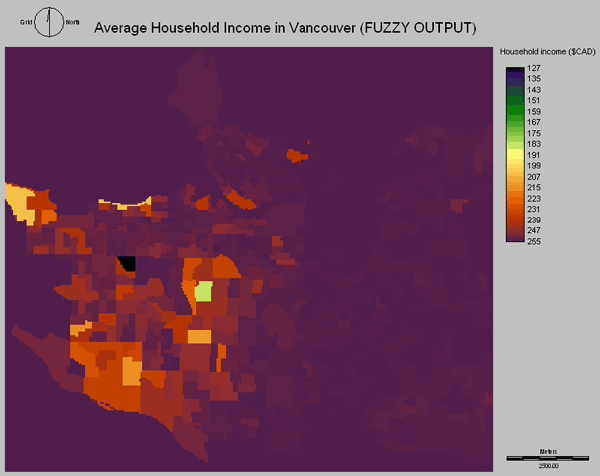
![]() Above
is the Fuzzy Output of the Average Household Income in Vancouver.
Above
is the Fuzzy Output of the Average Household Income in Vancouver.
