Data Source
The main data source for this project is the SIS lab's S:/ drive. This database provides the 2001 Census data of Greater Vancouver and transit data from Translink.
The addresses of community centres and libraries in my study area can be acquired from the official website of the libraries [6] and community centres [7]. Once all the postal codes and addresses are known, they can be converted to latitude and longitude in the geocoder.ca. Then, the location of libraries and community centres can automatically be projected and coded as new data layers in ArcMap.
Vector to Raster
Since all of the data are in shape file format, they need to be converted from vector data to raster data. The rasterization process for all files is done in ArcToolbox and ArcMap. The raster files are then converted to ASCII format and imported into IDRISI.
The projected coordinate system of the data is North American Datum 1983 and the geographic coordinate system is GCS North American 1983. All raster data layers have spatial resolution of 20 meters per pixel. The row and column of each layer are 1264 and 1410, which mean the geographic extent of each layer is 25289 meters from north to south and 28204 meters from east to west.
Data Preparation
The imported raster layers in IDRISI are not ready to be used, and data need to be processed and standardized so that they can be input in the study. The first problem of imported layers is that all cells with no data are assigned -9999, and the second problem is that the point data and categorical data layer are shown as continuous and quantitative data.
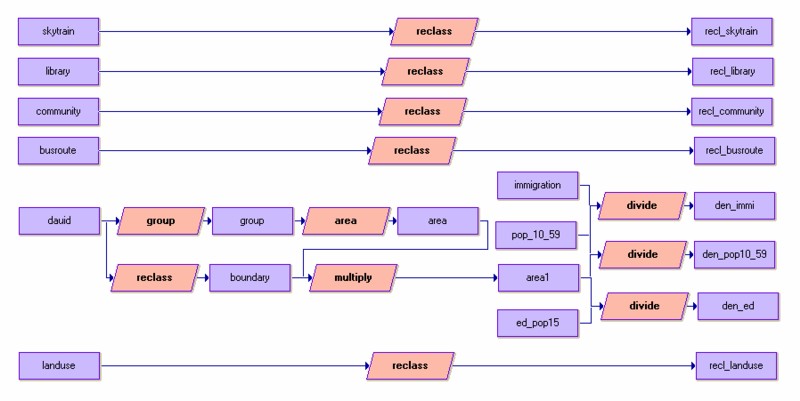
There are three solutions to tackle the problem. The first solution is for point or location data, which are the layers containing location for SkyTrain station, bus route, library, and community centre. The method is using “RECLASS” module to assign 0 to cells with values from -9999 to 0 and 1 to all positive integer’s cells. This method will create Boolean maps for location data. The second method is for categorical data, which is the land use layer. The “RECLASS” module is used to assign 0 to cells with values less than or equal to 0 and assign 13 different numbers (1-13) to separate the thirteen different land use categories. This method will resume the land use layer as a categorical layer. The third method is applied to quantitative layer, which are the three census data layers showing the population with age between 10 to 59, population with secondary education or higher, and population of immigrants. In order to eliminate the negative values, a Boolean map outlining the study area is created. Again, the “RECLASS” module is used, where the study area is assigned 1 and the rest is assigned 0. Then, the Boolean map is multiply to the three census data layers.
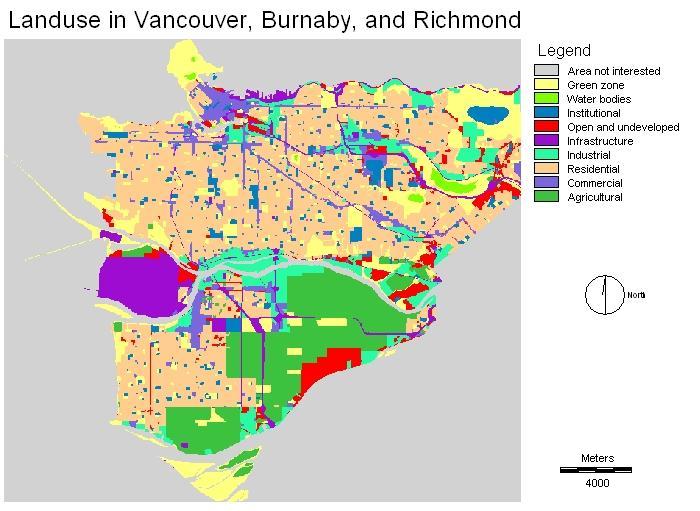
After processing the raster layers, some of them need to be standardized so that they fit in the analysis. First, since the census data are collected based on every dissemination area unit (DAU), and because it is more making sense to analyze and evaluate the suitability of place based on census data describing population per square unit, rather than population per a DAU, the numbers in the three census data layers is divided by the area of the DAU. The area is calculated from an imported data layer represent the Dissemination Area Unit Identifier (DAUID) by using “GROUP” and “AREA” modules. Then, it yields three files that show the density of population with secondary education or higher, age group between 10 to 59, and immigrants. Second, the original land use image with 14 classes can be dissolved and simplified in to 10 classes. They are outlined as following:
0. Area not interested
1. Recreation and Protected Natural Areas
2. Lakes and Water Bodies
3. Institutional
4. Open and Undeveloped
5. Transportation, Communication and Utilities
6. Industrial
7. Residential
8. Commercial
9. Agricultural
A cartographic model describing the process to prepare raster data files as input to spatial analysis.