


The Methodology of this project is fairly simple in concept. First and foremost it is a Multi-Criteria Evaluation (MCE). Combining the stated factors (Proximity to public transit, motorvehicle thefts, proximity to parks and vehicle accidents) together, assigning each factor a different weight, should produce an outcome of areas which are desireable to drive and undesireable to drive.
Because cars in the city are limited to paved roads the matter of constraints was fairly simple: The areas of study must be limited to roads ONLY. This was done by making the streets layer boolean (1 = roads 0 = Not road) and adding it as a constraint. How factors were processed and treated are shown belown:
Proximity to public transit:

Automobile Accidents and Motor Vehicle Thefts:
These were the only fuzzy factors in the project. A high number of accidents or thefts meant a higher degree of unsuitability (or lower degree of suitability).
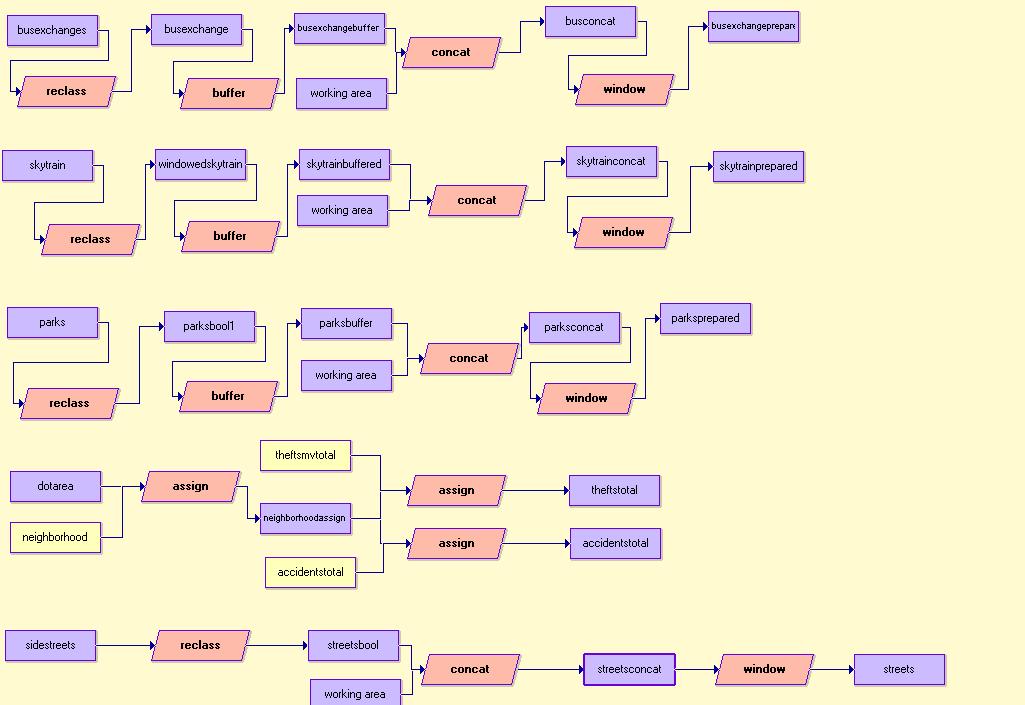
At this point of the project we have assigned accident and theft statistics to neighborhoods and also reclassified a number of factors to be boolean. We have taken these files and standardized the coverage area by using the concatenate and window modules. The image below is a cartographic model that summarizes what we have thus far:
Putting it All Together:
Now that we have done all the prep-work for each factor and constraint we can now conduct a multi-criteria evaluation. This was done using the MCE Decision Wizard in IDRISI.
1.
The lone objective was to locate the most unsuitable areas for driving and parking in Vancouver. 
2.
The objective was isolated to city streets and as a result the only constraint was a layer of Vancouver streets.
3. There were 6 factor files to input into the wizard.These factors were:
4. Next we move to factor standardization. The fuzzy factors of Accidents and Motorvehicle Thefts were both monotonically increasing. As shown in the graph on the right, as these numbers rise, the degree of unsuitability rises also.
5. Now we move on to weighting each factor. For this the AHP or Analytical Hierarchy Process was used.
Different configurations of weights were attempted for this process. When the Motorvehicle Thefts and Automobile Accidents were given a high weight there was almost 0 variation in the output layer. This meant that parks and transit could be interpreted as having no effect which in the real world is untrue. This will be discussed more indepth in the Discussion and Conclusion portion. In the mean time, to show variation, and the effects of parks and transit, these factors were given higher weights than the motor vehicle thefts and automobile accidents.
With the weights given and the Wizard complete we can now move on to the analysing the output of the project in the Spatial Analysis page or return to the Top of the Page.
