Where O Where Do I Open
a New Consignment Store in Vancouver?
Cartographic Models:
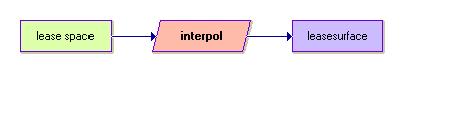
Model for interpolated lease
coverage. Used a distance weight exponent of 5 instead of 2 to make the
near values have a greater effect on the interpolated values than the
further values.
_____________________________________________________________________________________________________________________________________
Model for overlay of
interpolated lease coverage and Boolean image of Commercial areas in
Vancouver. See the image commcost here.

_____________________________________________________________________________________________________________________________________
Entire cartographic model for
my project:

Note: The lines
connecting the fuzzy raster images with the weight modules and the
lines connecting the weight modules to the mce modules should be
arrows. These were put in in Adobe Photoshop and unfortunately
are only lines. Also, all of the raster and vector images used
initally needed importing from ArcMap. I did all of my geocoding,
database joins, field calculations and database trimming in
ArcMap. I then imported them to IDRISI, where I either converted
to or interpolated to a raster image. The final images, mce_1 to mce_5,
can be seen through the link to the Spatial
Analysis page.
Go Back to Data
Acquisition, Introduction, Home