This section will be the largest since there will be several aspects of the project that will be discussed. Firstly, there will a chronological, step-by-step description of what was done. This will include all operations and spatial analyses that were done. This section will also display many of the images that were created as well as a cartographic model, explaining what exactly was done.
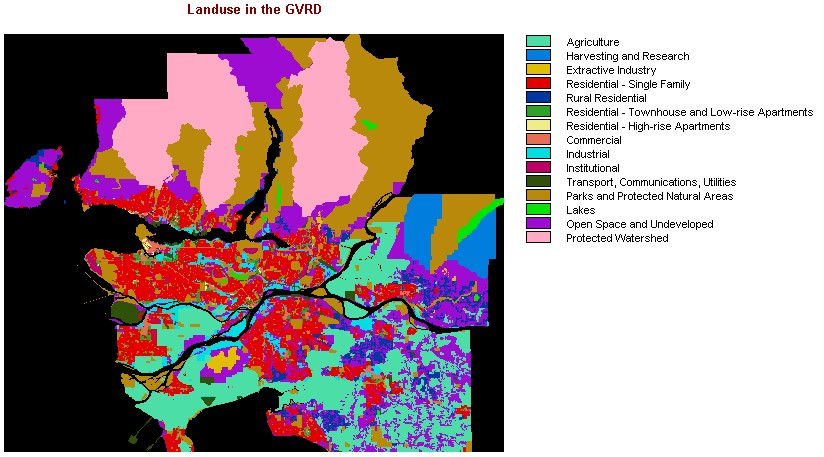
To begin with, I first needed to know what type
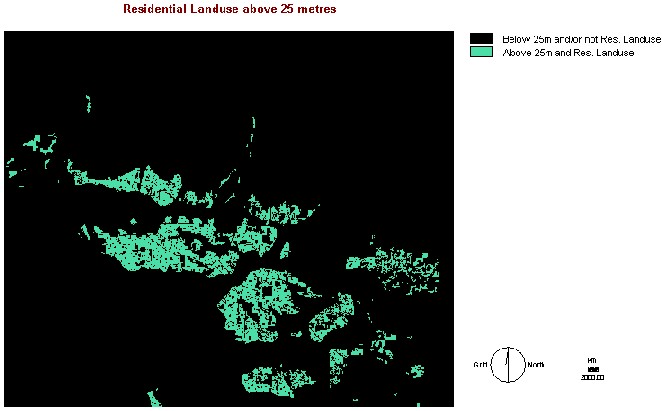
of land was available for residential development. That was possible with
the LANDUSE image.
From this image, I was able to easily determine
what land was available and where. To better understand just how much land
was actually used for residential purposes, I assigned all types
of residential land use to be shown and have all other land types not to
be shown. This new image was called RESIDUSE:
I wanted to show all types of residential land use types because they included all possible types of residential dwellings (single family homes, apartments, townhouses,etc.). As the image suggests, it is possible to build in all municipalities in the Lower Mainland, however, most of the space available is in heavily populated areas, such as Vancouver, Burnaby and Surrey.
The next step was to determine the height of the areas around the Lower Mainland. To do this, I opened GVRD_DEM. The problem with this image was that since most of the Lower Mainland is at a low lying elevation, most of the municipalities did not show up. To counter this, I changed the maximum value from 1967.5 metres to 300 metres. That latter elevation is arbitrary. I just wanted to better see what areas were within 300 metres in height as opposed to 1967.5 metres. From this image, I used reclass to change the image to show all areas that were 25 metres or higher in elevation.
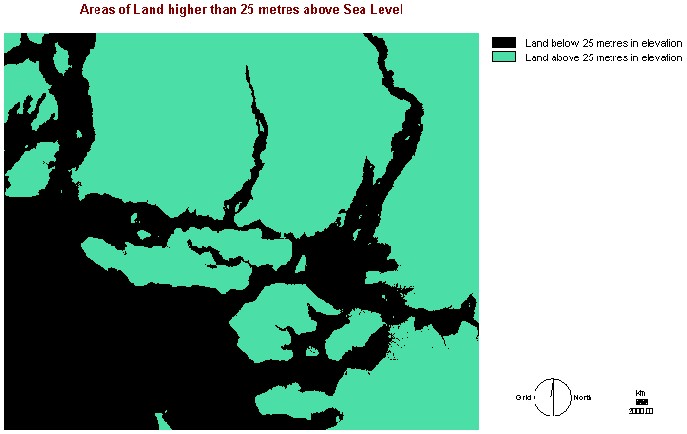
This image, DEM25, showed a lot of the Lower Mainland
but a good portion of it was mountains. It is also evident that Richmond
and most portions of Delta are not in this image so as my initial prediction
suggests, Richmond and Delta will not have any areas available for development
based on my criteria.
Next, the two new images that produced were overlayed
using the overlay command, to produce REHEIGHT. This was done to
show the combination of land use that was available for residential development
which was at least 25 metres above sea level. 25 metres was chosen since,
even in a 500 year flood, which would be near catastrophic, the chances
of the water rising to such heights would be very minimal. Being the developer,
I would not have to worry about my building being flooding and the occupants
would have piece of mind not having to worry much about having to be relocated.
The overlay operation also reduced the possible sights of where to develope
further (mainly Richmond and Delta).
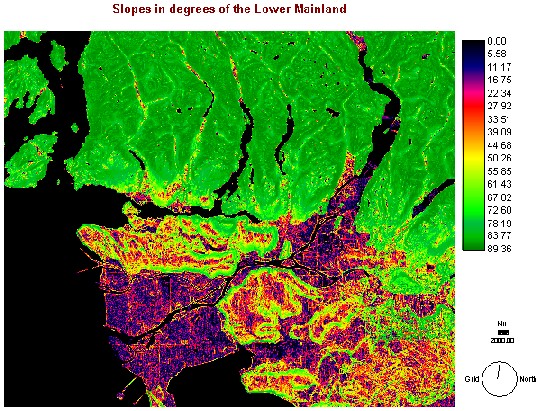
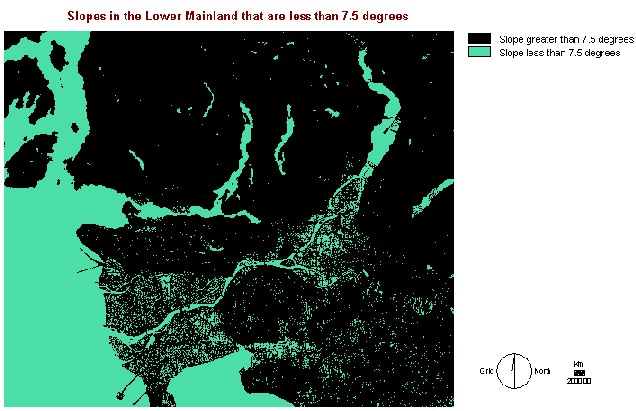
Another criteria I was using to help determine a suitable developement area was the slope of the land. Again, this is used as part of the decision because building on a steep slope increases the chances that during a natural disaster, such as an earthquake or landslide, of slope failure, potentially causing great damage to the residential dwelling. In order to find the slope, I used GVRD_DEM as my primary image. From that image, I ran the slope operation to produce GVRDSLOPE.
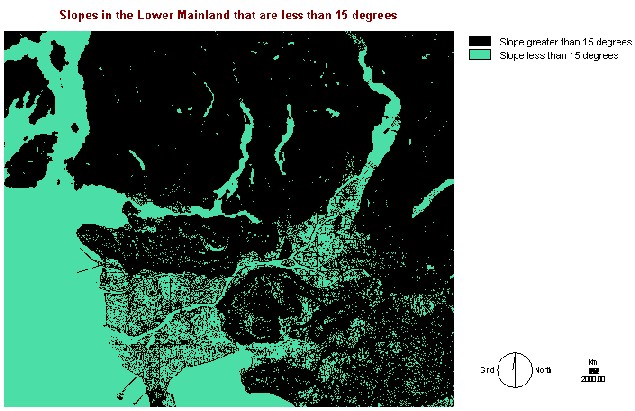
I used reclass to determine the parts of the Lower Mainland that were built on a slope of 15 degrees or less, and then I decided that that slope still might be too steep so I used reclass again to show slopes that were 7.5 degrees or less (GVRDBESTSLOPE & GVRDBESTSLOPE2 respectively). There was not a large difference in the images but they will alter the final image, as will be shown later.
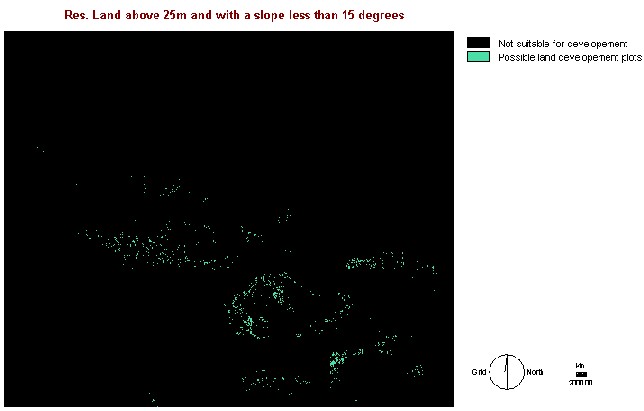
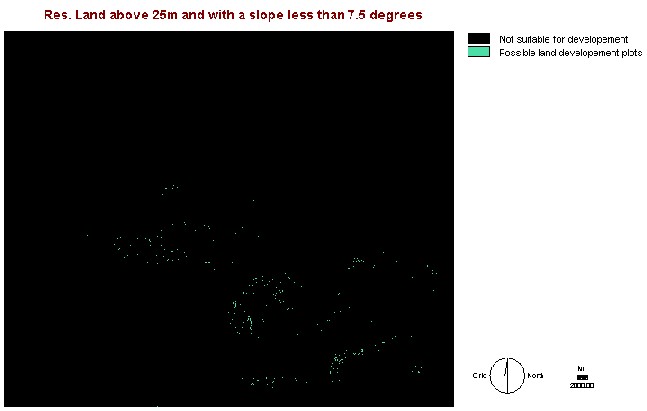
Afterwards, I now needed to combine the best slope images with the image of REHEIGHT. This combination would show the areas that are possible to develope residential housing, at a certain height and slope. Using overlay again, I combined GVRDBESTSLOPE with REHEIGHT as well as GVRDBESTSLOPE2 and REHEIGHT to produce RESSLOPE and RESSLOPE2.
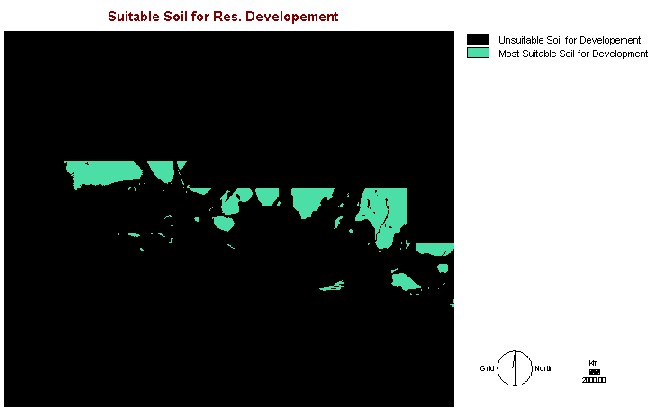
One of my criteria for choosing the best areas for
development was soil type. The particular types of soil which I thought
to be the most sturdy was granite and sandstone, shale, and volcanic materials.
In order to show only those types of soil, I added a field within the database
workshop associated with the SOILS image. I called that field Suitable_Building.
After the field was created, I calculated the field value so that only
the areas with soil types of granite or sandstone/shale/volcanic would
be given a value. Then an attribute value file was created. Using the edit
and assign operations, I created an image which showed only the
soil types mentioned above, based on the attribute value table and called
it BESTSOIL. upon the creation of the image, it was converted into byte
form and called BESTSOIL2.
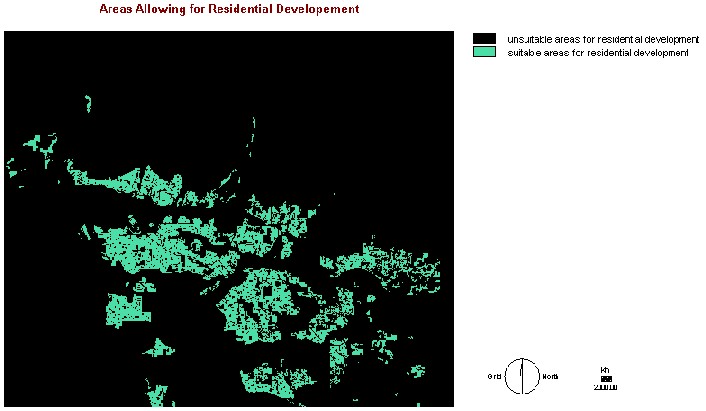
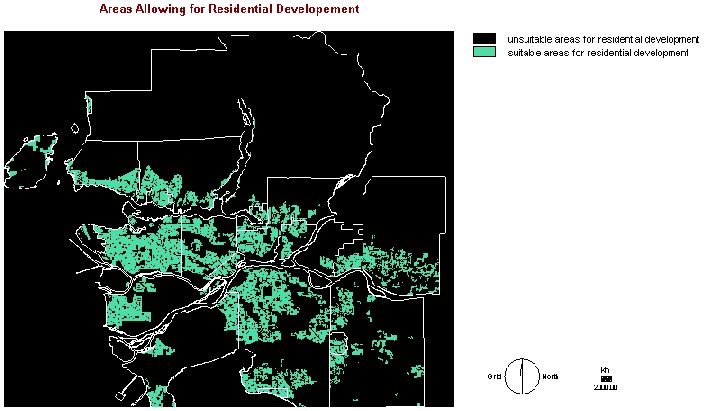
To finally calculate where the best possible areas to building a new residential development, I used MCE to combine RESSLOPE, GVRDBESTSLOPE and BESTSOIL2. This operation was done twice since for the second operation I used GVRDBESTSLOPE2. The final results will be discussed in the next section but the images and the outcome were surprising.
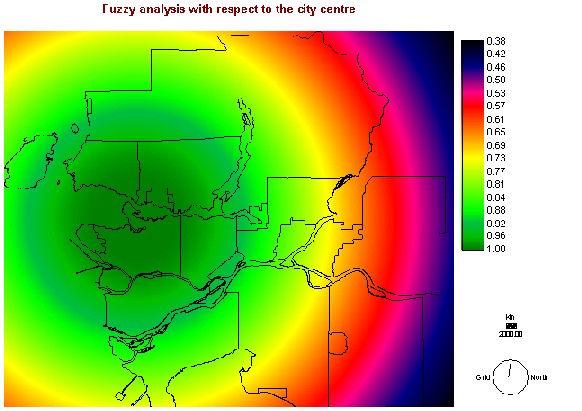
In order to get a better understand of where the possible developments are located, I also created a vector image of the city centre. This image could be added as another layer superimposed over another layer, giving a better indication of the relationship between the city centre and the final areas calculated for development. However, I also used that point to show how suitable the areas were with relation to the distance away from the city center. To do this, I first rasterized the vector point using pointras to create CCRAST.
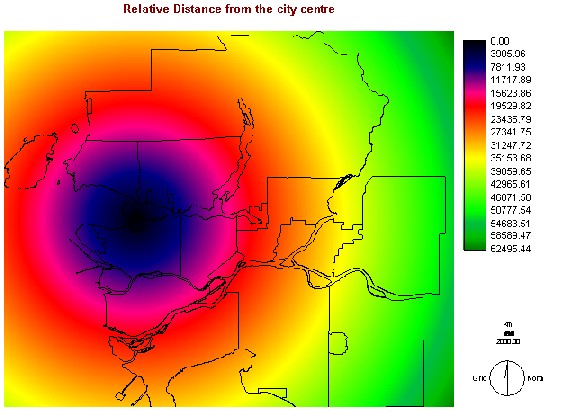
I then used the DISTANCE operation to show the distance
from the centre of the city compared to the rest of the Lower Mainland.
I then added the city layer over top to show relative reference.
Finally, I used Fuzzy to produce CCRASTFUZZ
and added the CITY layer over top to give another indication of the proximity
of the areas are compared to the city centre.