Data Acquisition and Preparation

All data is acquired through the Hawaii Statewide GIS program operated by the state Office of Planning.
The data is in ArcGIS shapefile format in vector data structure.
- Coastline
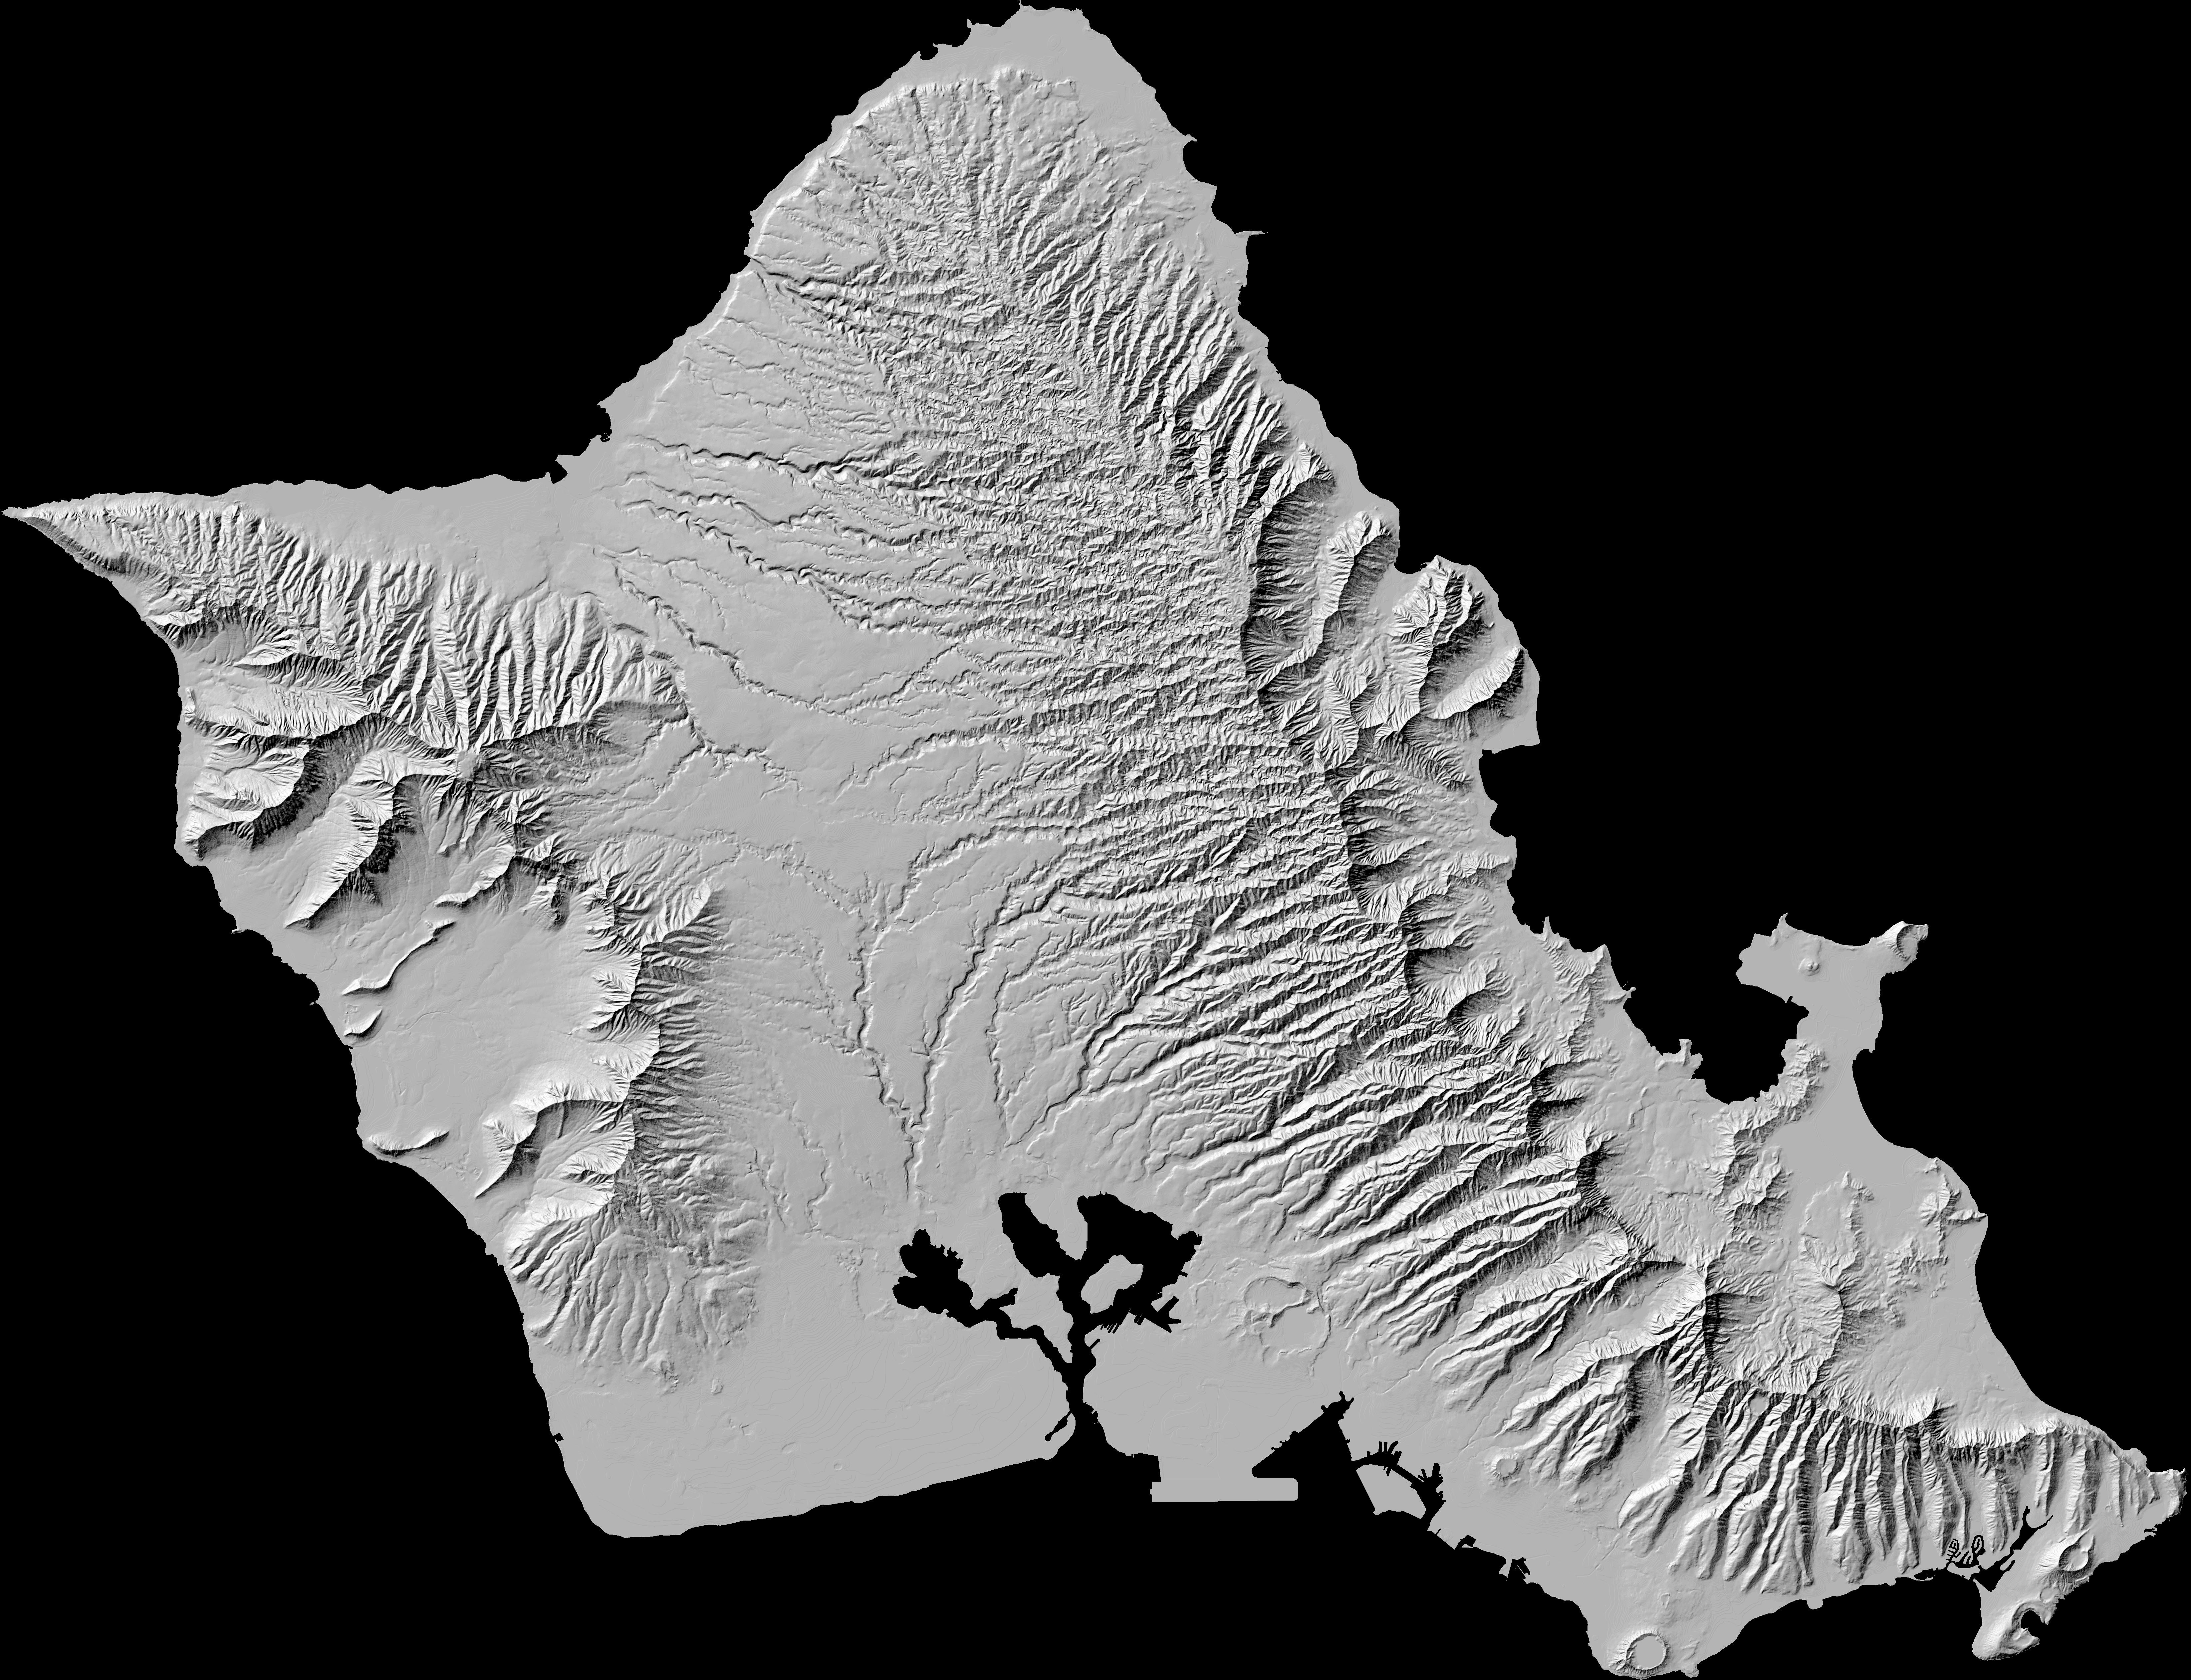
Coastline is used as a base map to overlay other factors to use in the Multi-Criteria evaluation. It also serves the purpose of excluding the ocean as a possible location for the development of a solar power plant.
- Solar Radiation
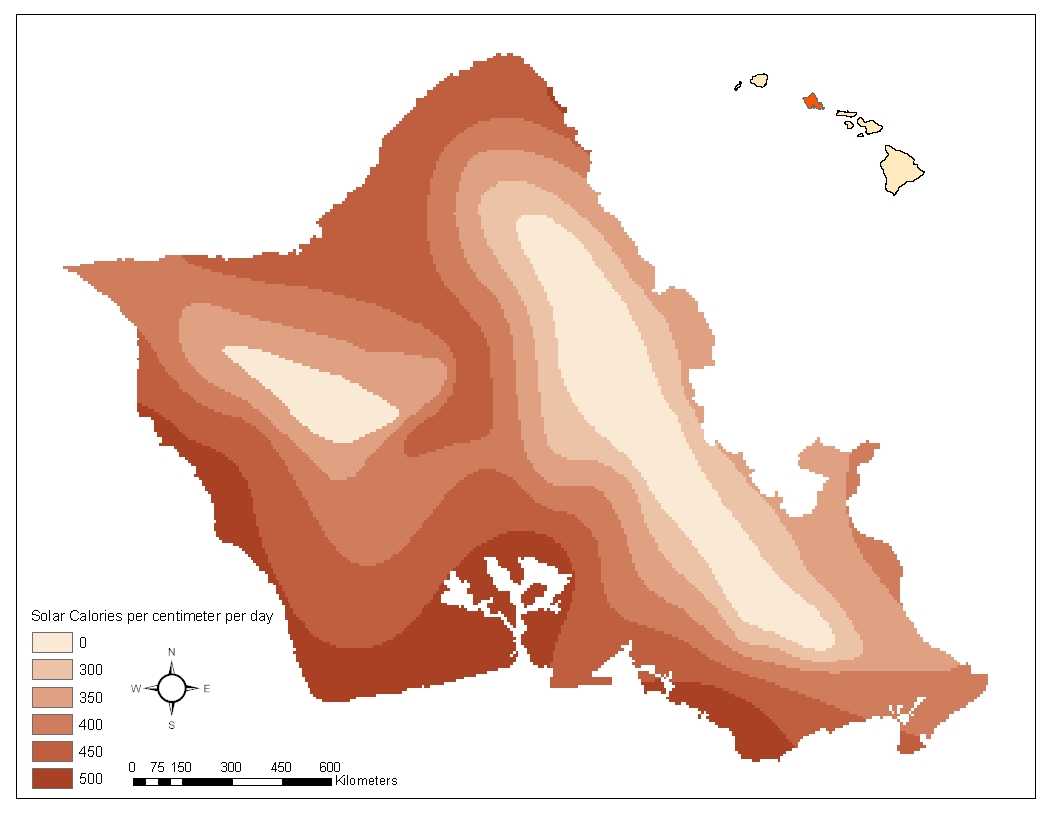
Solar Radiation is calculated using solar calories per squared centimeter per day. The higher the amount of solar radiation an area receives, the more energy the solar power plant can be able to provide for the citizens of Oahu.
- Area of Threatened and Endangered Plants
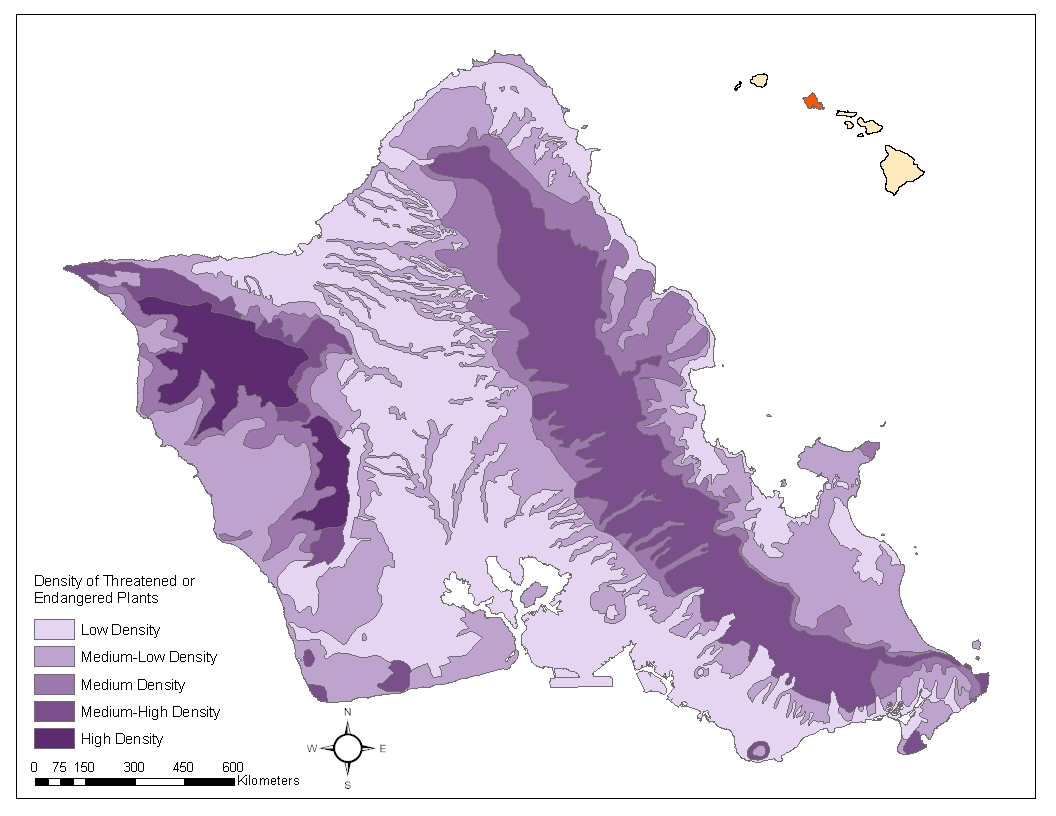
The area of threatened and endangered plants is calculated using the density of endangered and threatened plants in a given region. The development of a power plant will require the removal of plants and endangered and threatened vegetation should not be eliminated for the building of a solar power plant.
- Power Lines
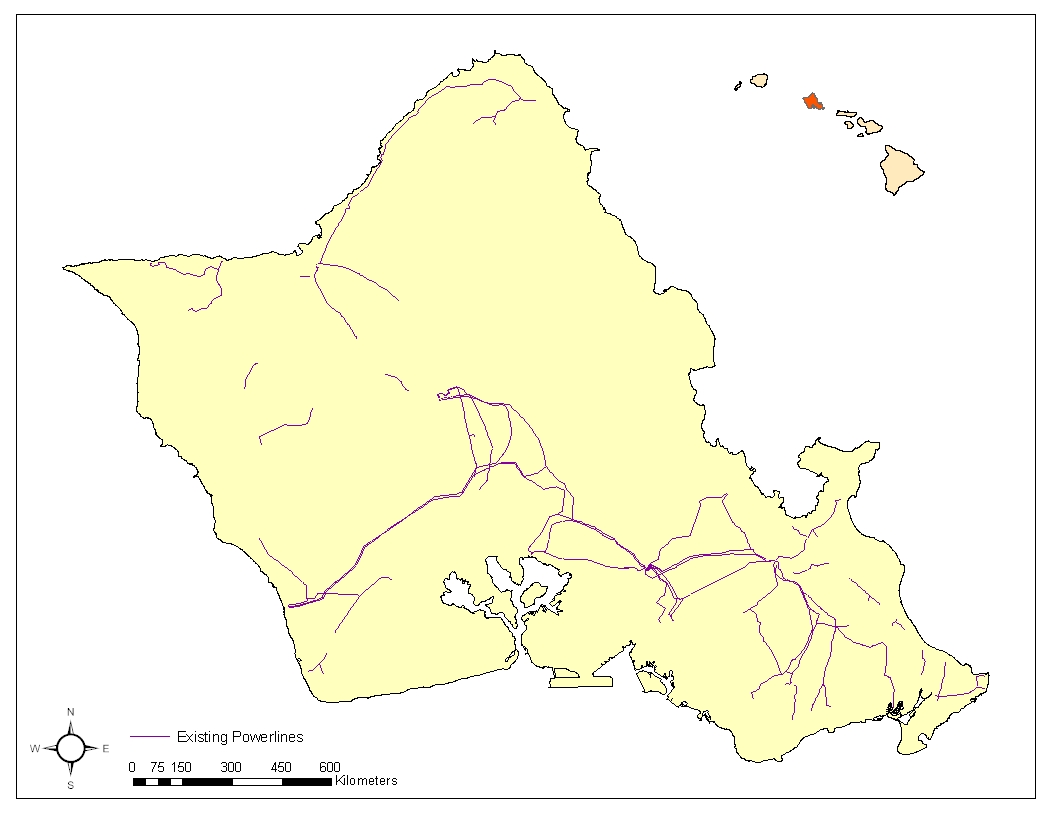
The power line layer will be used in proximity analysis to determine the location of the potential solar power plant. The ideal location of the solar power plant should be as close to existing power line as possible to increase the efficiency of the building process.
- Dam
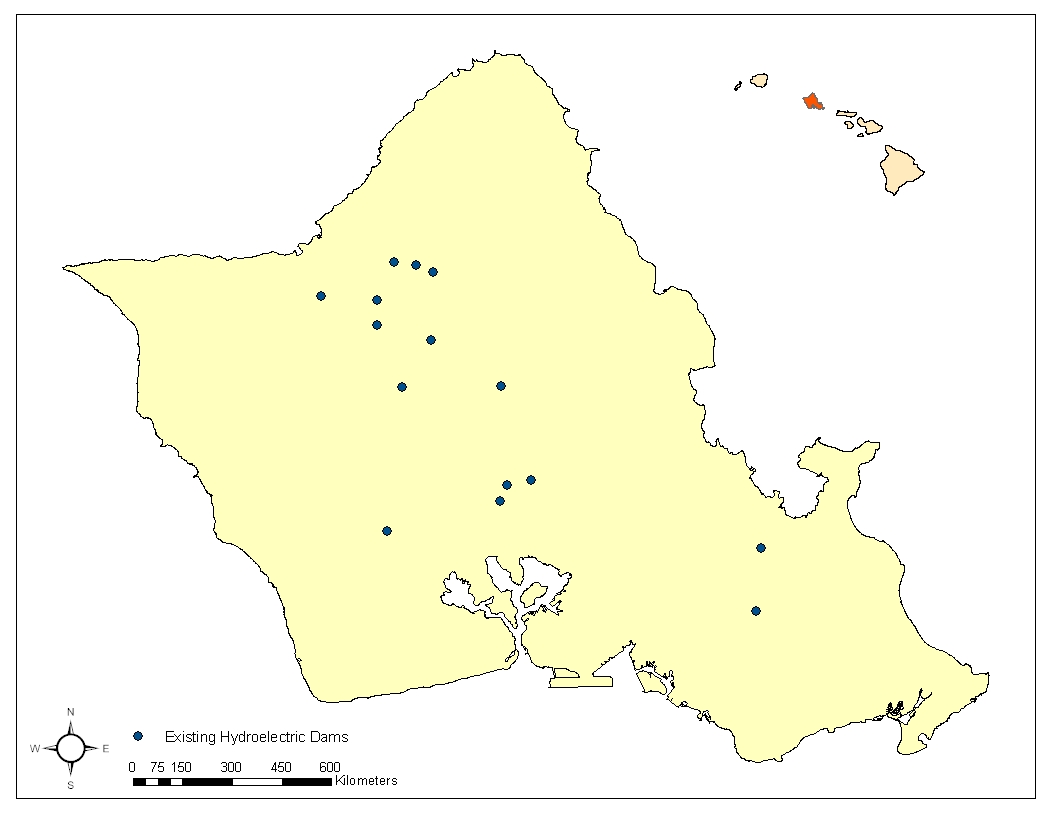
- Roads
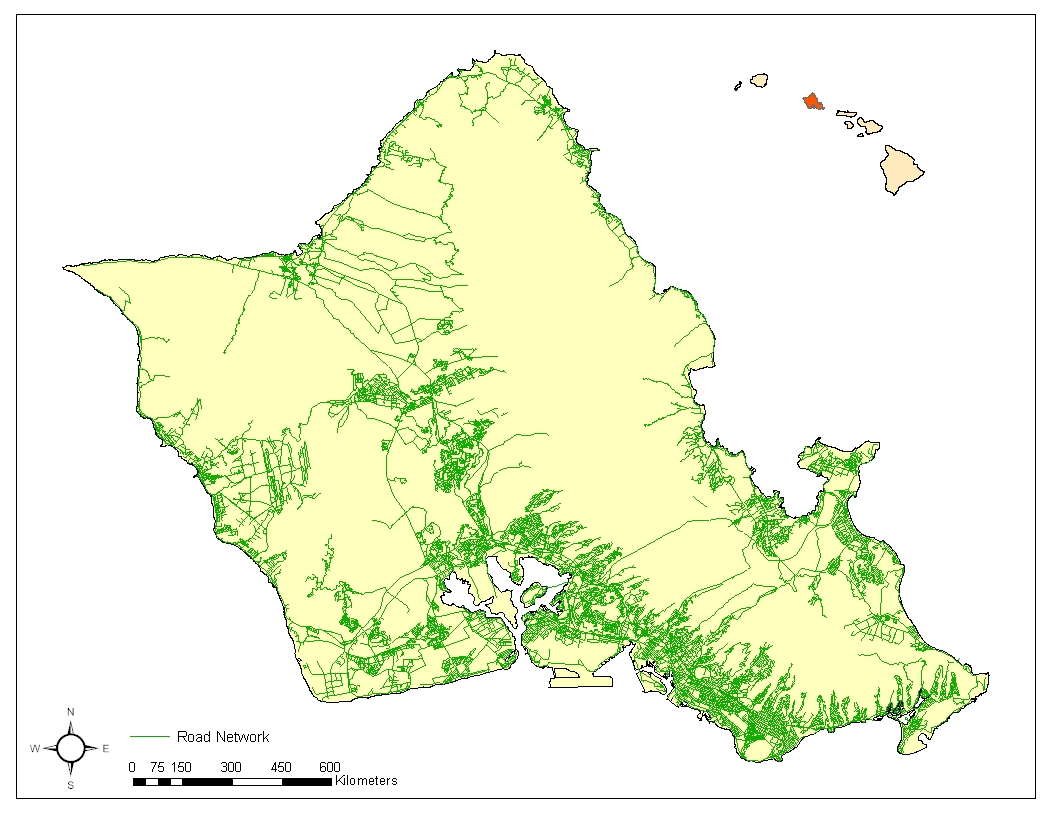
The roads will also be used in proximity analysis because the power plant needs to be maintained which requires roads so that workers can access the facility. If the power plant is close to existing roads then there is no need to build extra roads which can save the state more money.
- Stream
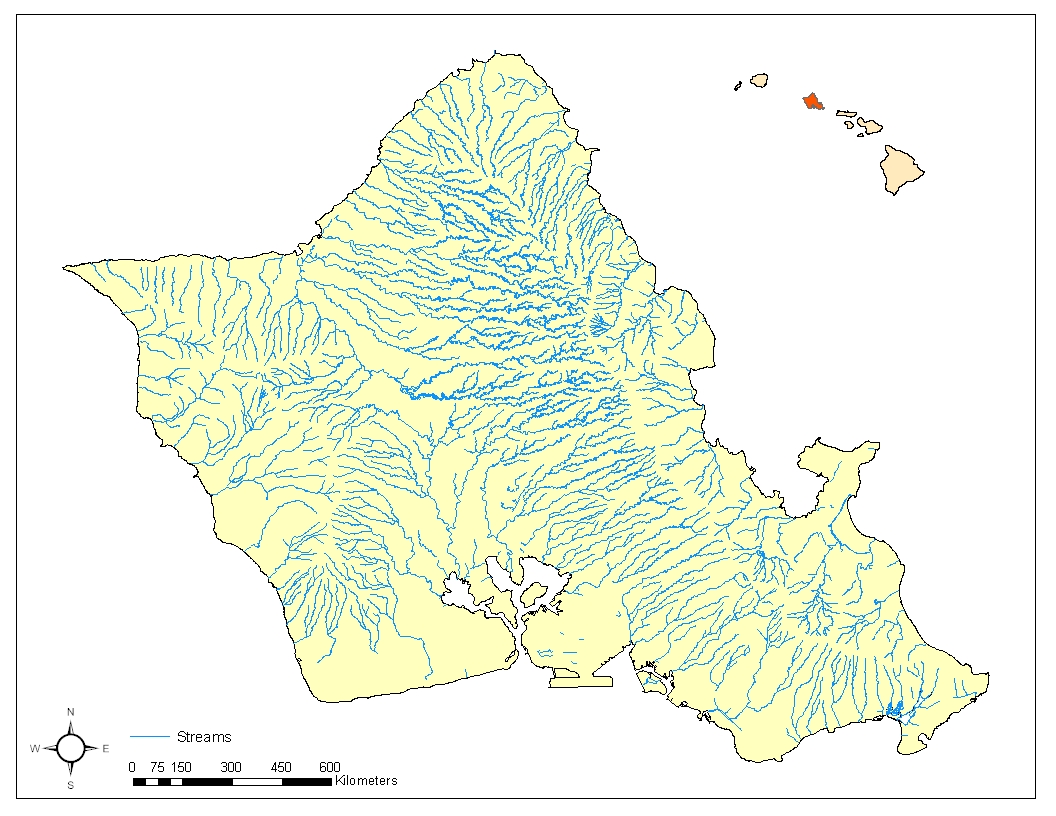
The island of Oahu is filled with streams, any development should be away from streams so that the pristine environment would not be disturbed by urbanization.
- Critical Habitat 1
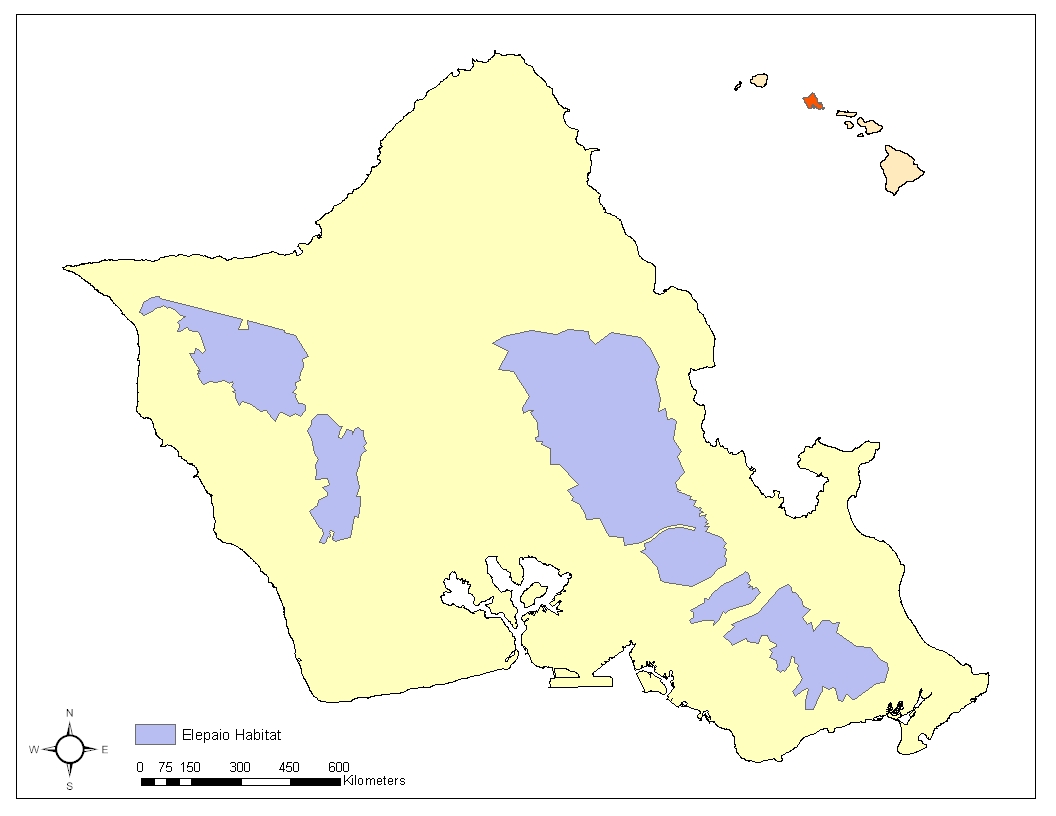
Two different critical habitats specific to the island of Oahu are used as a constraint to prevent the development of a solar power plant in areas where it will affect the habitat of endangered species. The two types of critical habitats are: plants and elepaio.
- Critical Habitat 2
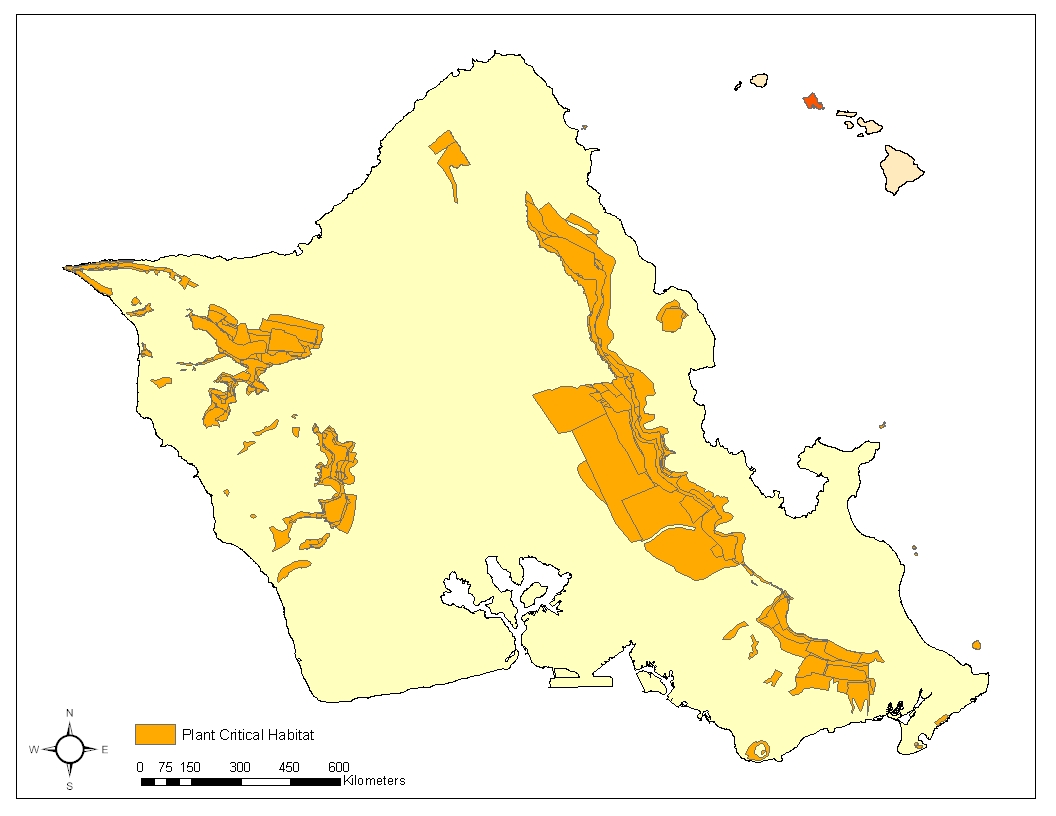
The data is manipulated in ArcGIS as well as IDRISI. In order to make the data suitable for multi-criteria evaluation, the data would need to be transformed from ArcGIS vector format to IDRISI raster format.
There are numerous steps that need to be taken in order to change the format of the data from ArcGIS vector to IDRISI raster. All the data mentioned in the section above needs to follow all of the steps in order for them to be ready for input in IDRISI.
1) From ArcGIS shapefile to ArcRaster
The first step in transforming the format of the geospatial data is to change the format of the shapefile from vector to raster. The function of Feature to Raster in the Arctoolbox is used to transform all the data from vector to raster. Some other procedures are also involved in this process. First, one has to check which field in the dataset to base the transformation on, the field in the attribute table has to be numerical in order for the transformation to take place. Some data manipulation is required in some cases to add a field of numerical values based on a non-numerical attribute field to allow the data transformation to happen. Data such as threatened and endangered plants and solar radiation has to be manipulated for the data to change the format from vector to raster.
Threatened and endangered plants territory used a non-numerical attribute field to identify density, so a numerical attribute field according to the non-numerical density field is added to make the transformation possible. The solar radiation data is also manipulated due to the value of solar calories being too big to compute, therefore, the data is changed to a scale of 1 to 5 to make the transformation and future analysis easier. In order for the raster cell size to be consistent with each other, the largest cell size out of the entire dataset is used to make the data consistent.
2) Raster to ASCII
Before changing the raster format in Arc to IDRISI, ArcGIS has to first transform the data into an interchangeable format, ASCII. ASCII is a text file that can be interchanged between Arc and IDRISI. Even before changing the data from Arcraster to ASCII, there is another issue with the dataset. Once the data is changed from ArcRaster to IDRISI raster format, the area extent of each dataset might be different. All of the datasets need to have the same spatial extent in order to make the MCE possible. The function of Raster Clip from ArcToolbox is used. Using the largest spatial extent of all of the data, the other data is clipped using that spatial extent. After all the data is clipped to have the same spatial extent, the data is now ready to change from ArcRaster to ASCII. Using the function of Raster to ASCII in ArcToolbox, each of the data is transformed to the ASCII format.
3) ASCII to IDRISI Raster
Once all the data is in ASCII format, the data is then taken into the program IDRISI Kilimanjaro to make the final transformation. Using the Import Data option under the File menu bar, each of the data sets is then transformed from ASCII to IDRISI raster. Once the data is in IDRISI raster format, the data is now ready for further manipulation using IDRISI and the actual analysis.

4) IDRISI data manipulation
All of the data manipulation in IDRISI is done either through reclass or assign. Some of the datasets which came from ArcGIS might need further data manipulation once imported into IDRISI. Some data which originally used unique identifiers for the basis of data transformation will now need to change its attribute in order to generate the data for overlay. This can be done using reclass and assign. In this project, only reclass is used, however, both functions can be used to achieve the same results. The three critical habitat data layers were changed from identifiers to a Boolean format to use as constraints.
