Spatial
Analysis
Analysis 1 -
Suitable
Habitat Selection
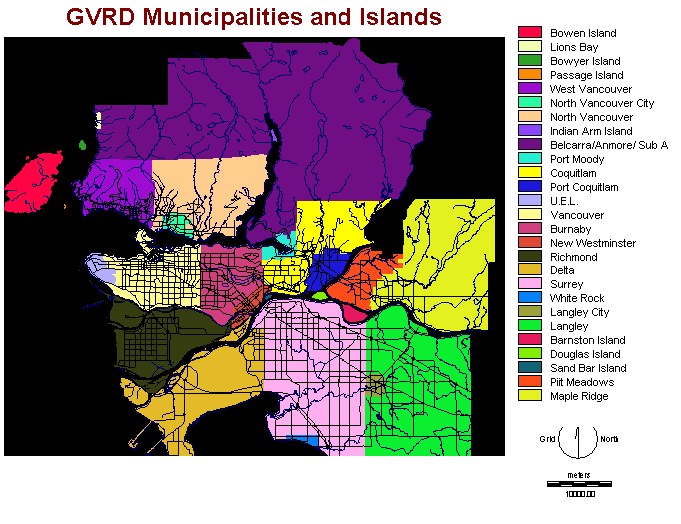
This is a base map of
the GVRD. It
shows the various municipalities and islands as well
as some of the major roads and water
bodies. This map acts as a reference for all the maps in the analysis.
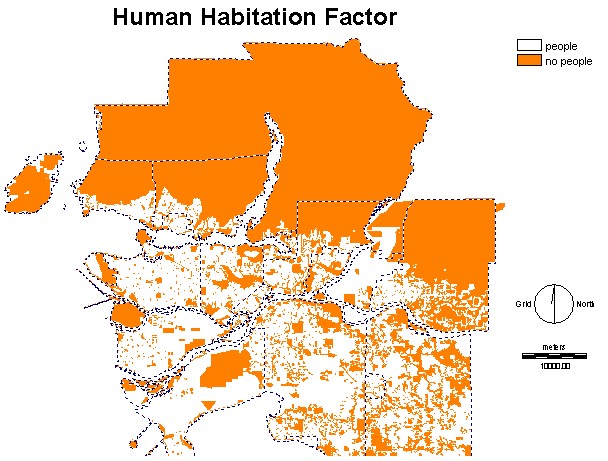
This Boolean image shows all of the
areas in the GVRD that have no people inhabiting it. This is the only
contraint in the habitat MCE, but
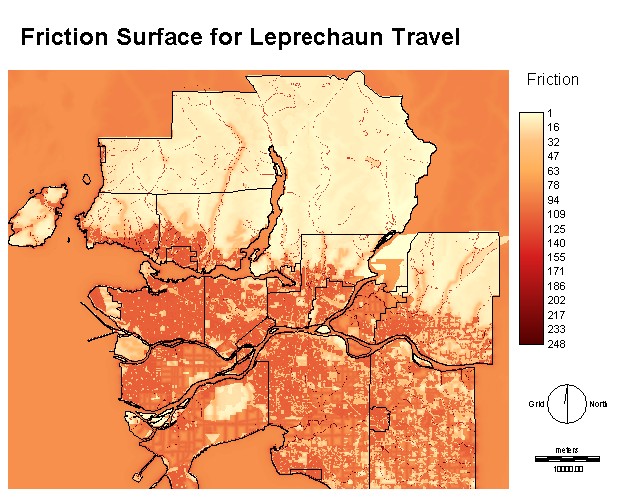
it was used as a factor in the friction
surface MCE. Most of the areas without people are in the northern,
mountainous
region.
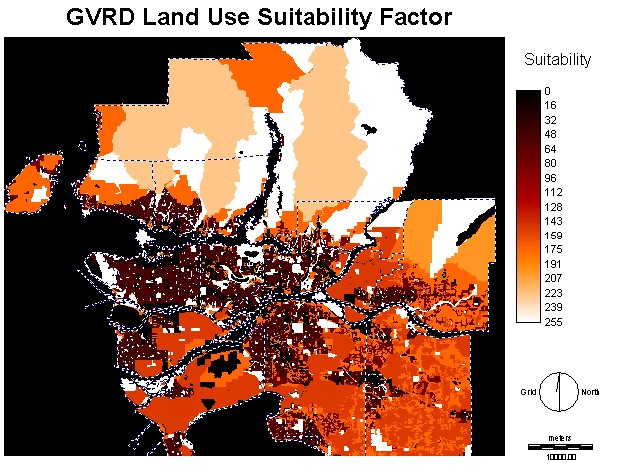
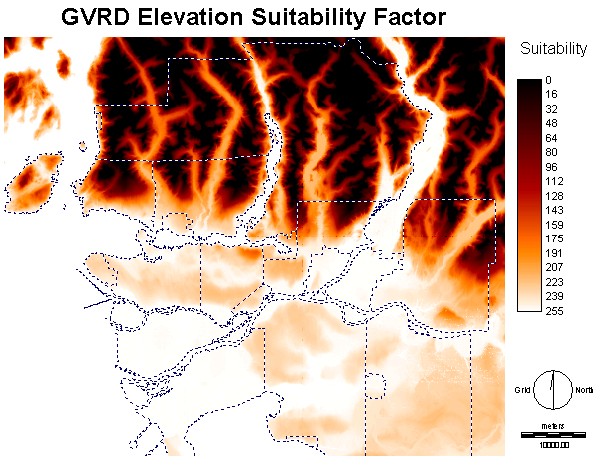
This image
shows the land use layer in its reclassified version. Like all the
other
factors in the MCE, this one is based on a 0 to 255 scale so that it
can be compared to
all the other factors. Agian, we find large areas of high
suitability in
the mountain region.
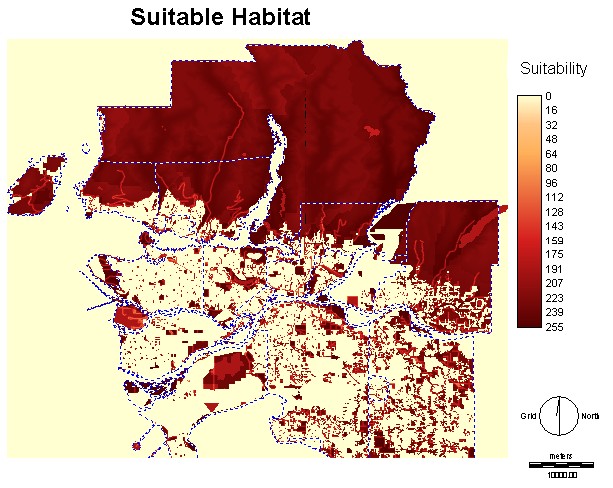
This map is the
combination of all the factors and contraints in the
MCE. There are a variety of different suitablilities, but there are
three
larger areas that have the maximum level.
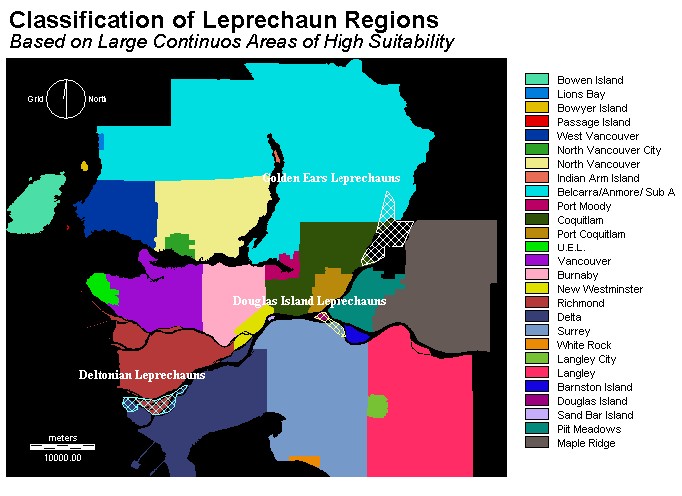
This digitized layer shows three distinct
populations of leprechauns based on the large areas of greatest
suitablility.
Analysis 2 - Determining Highly Used Leprechaun Pathways
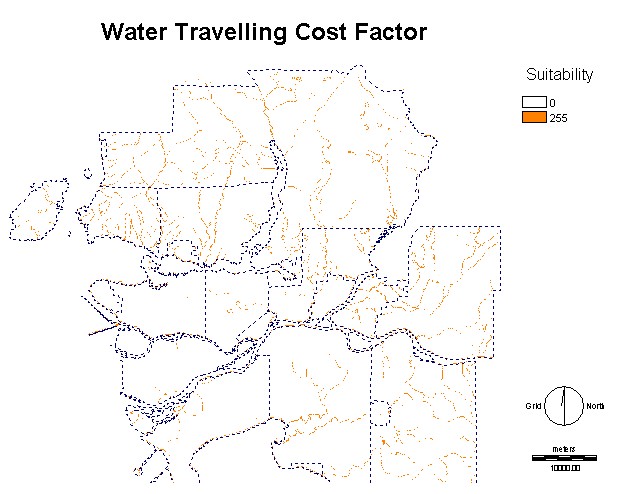
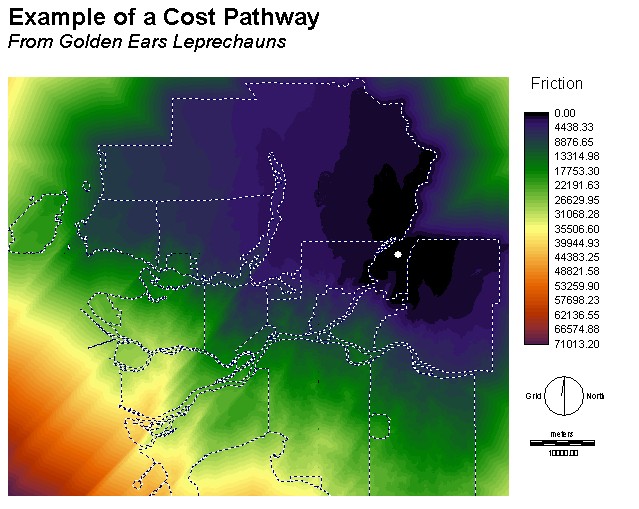
This is an example of
a 'costdistance' surface. It shows the difficulty of travelling away
from the
first, Golden Ears, region. One of these was created for each of the
three
regions and is used in finding the best pathways.
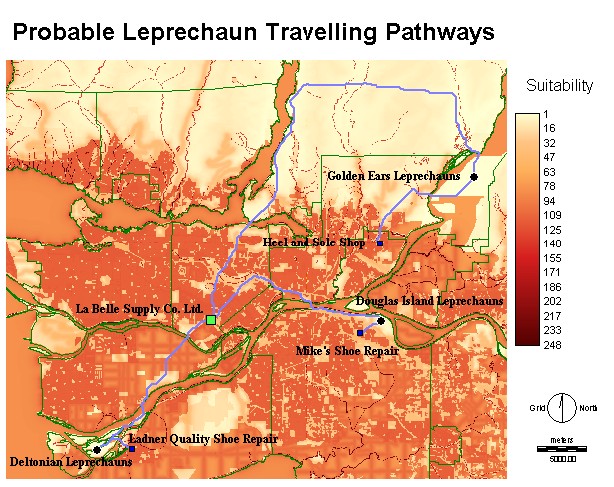
This final map shows
all of the most
suitable pathways. The black circles
show the centers of the three leprechaun regions, the blue squares show
the
closest shoe repair stores, and the large green square is the
single shoe
supply store.
