Timothy Tembo
Motion Tracking (Work-Study Individual Project)
I worked on an individual Motion Tracking project in the School of Engineering at Simon Fraser University, from January to August this year. I researched and analyzed sensor data for the activity of participants in various homes. I also developed a Python program to produce visualizations of the analyzed data.
The visualizations were helpful because of how they could also show a change in the behaviour pattern of the participants.
Research
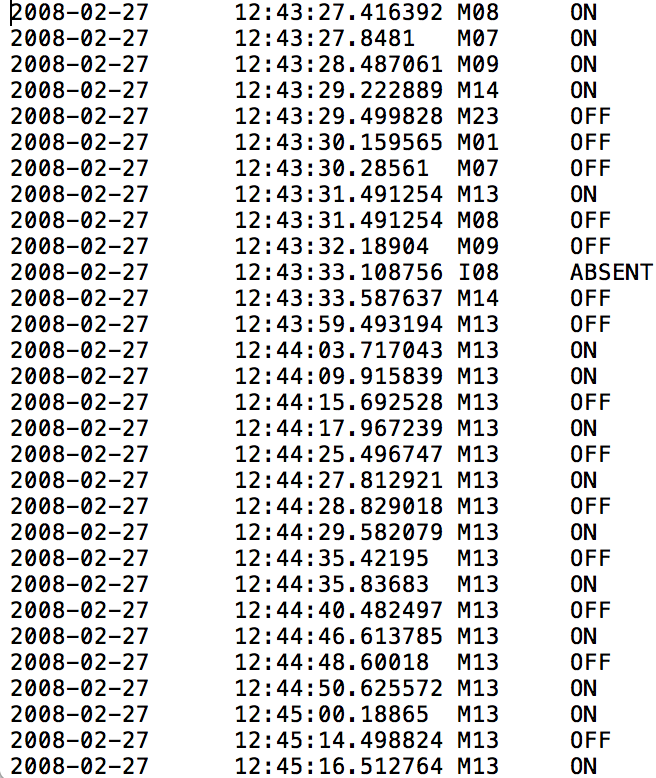
I used the dataset of the motion sensors from the Center for Advanced Studies in Adaptive Systems (CASAS) website, in order to see how long a participant spent on a specific task. The data was in the form of a text file.
Hand-drawn visualization
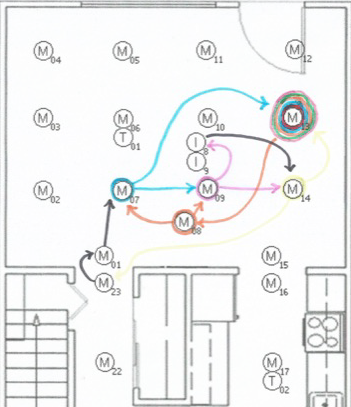
Based on the data from the textfile. I drew some visualizations by hand, in order to show the movement of people in the apartment. The M13 sensor was set off more frequently than the other sensors, because of how the participant visited that area a lot between 12:43 PM and 12:49 PM
Matlab Code
It was a challenge to come up with MatLab code that would automatically read the data from the textfile and generate a visualization, so I subsequently wrote python code that revealed the number of times that each station was visited.
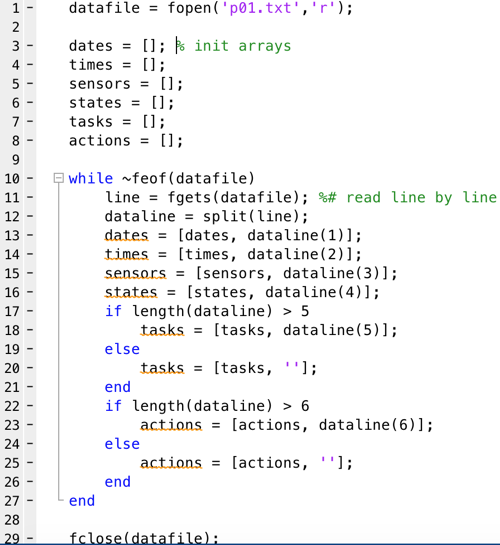
Python Code
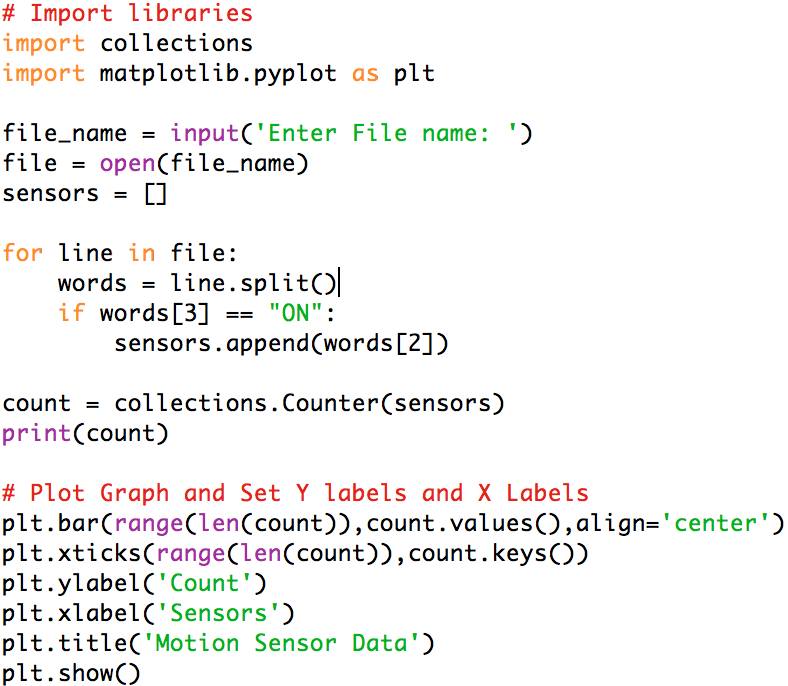
This Python code illustrates how the the program read the textfile line by line and produced visualizations based on the number of sensors that were set off.
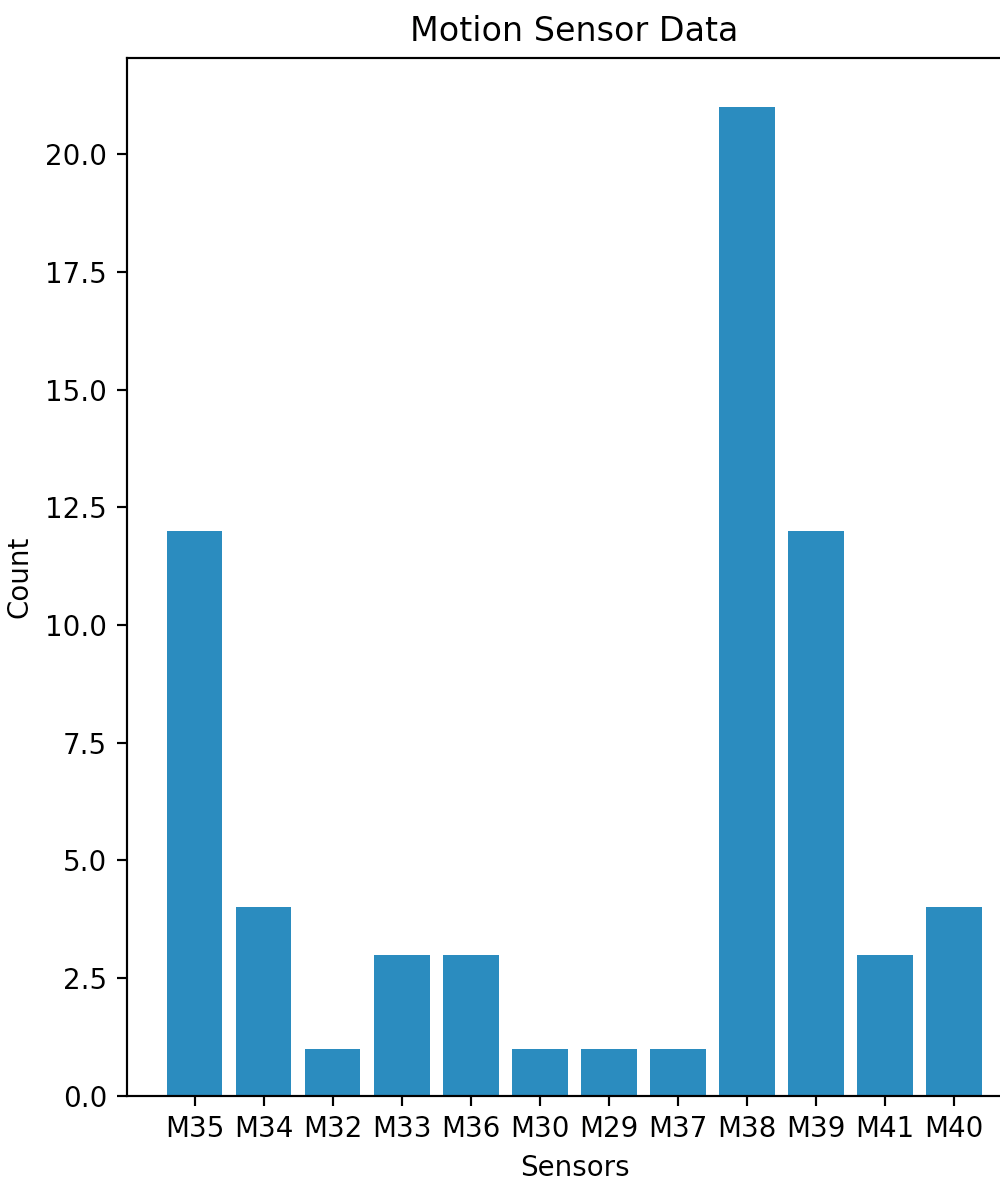
Python Visualization
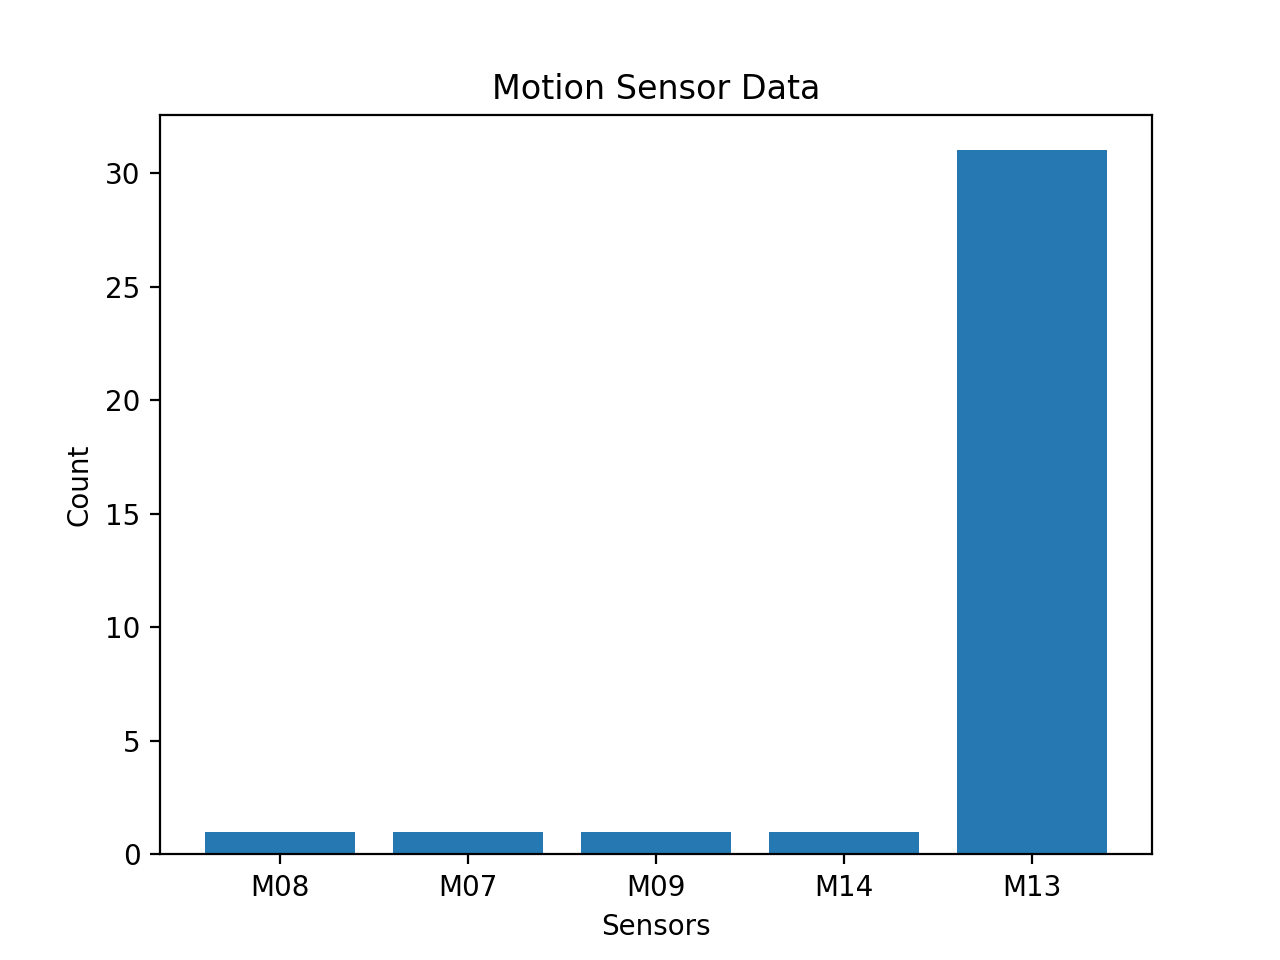
The bar chart below also reveals how the M13 motion sensor was set off more frequently than the other sensors. This visualization is very useful because how of how it easily illustrates which stations were visited. Sensors that were not set off do not appear on the bar chart.
Reflection
I improved my research, programming, and problem solving skills in this project. I tried various tools that could conveniently help me accomplish the task.