Animated Bar Chart
Group of 2 | Designer/Programmer
With a partner, I created an animated infographic that comparied economies of the largest powers during 1950 to 2000. It is an interactive bar chart that reads Big Data and represents it on a human readable scale.
Utilizing D3 in JavaScript to process the data, I created an interactive infographic through HTML and CSS that illustrates economies. I wanted to design an easy to use product for users that simplifies massive amounts of data and presents them at a human readable scale.
Initial Considerations
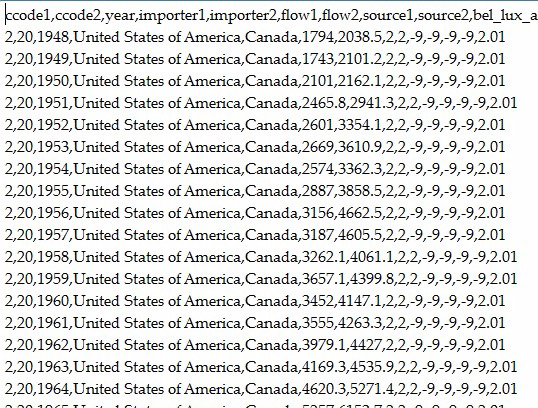
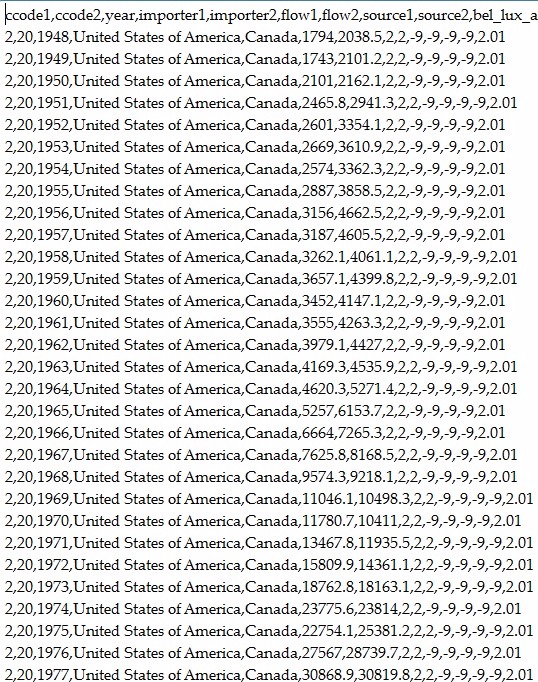
The raw data that was aquired to create the visualization
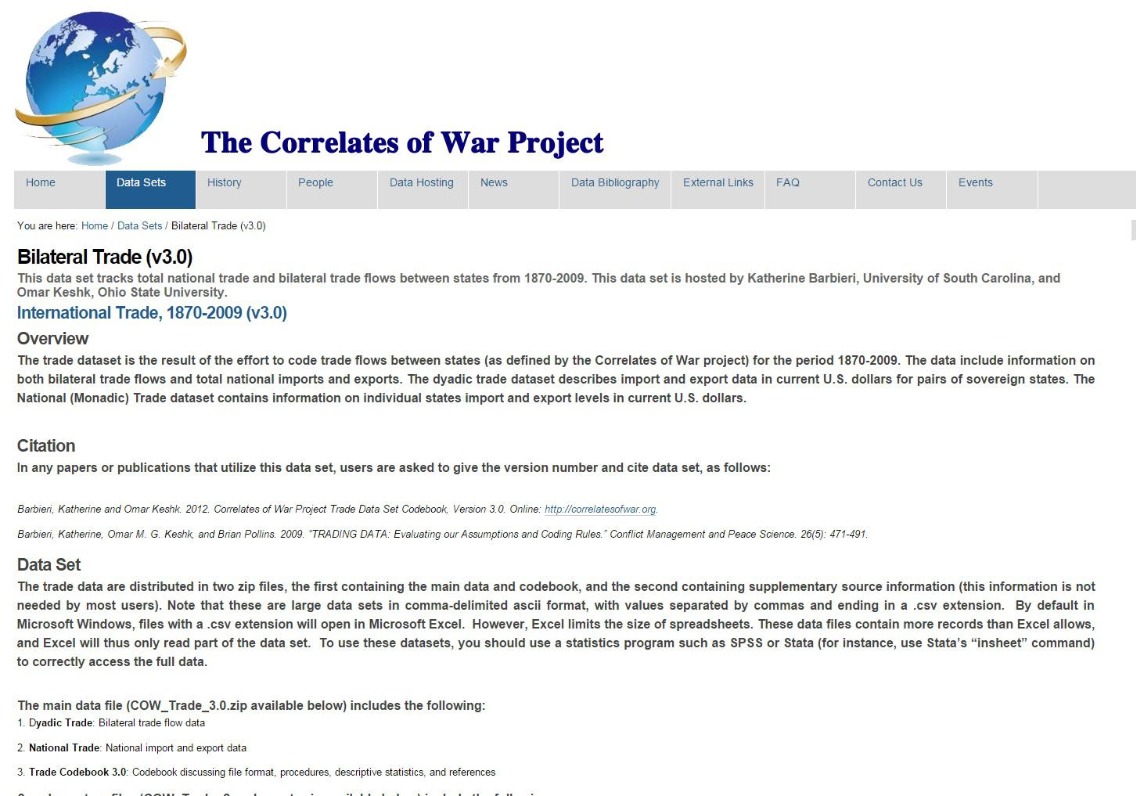
Data came from the "Correlates of War" project which hopes to provide data reliability for the international relations community
There was a lot of data so I decided to consolidate into the most meaningful parts to include most of the largest economies during the time periods.
Correlates of War wanted to convey international relations data in as clear way as possible. The infographic that I had to create required firguring out what parts of the data is really needed to show meaningful view to be of use to users.
Prototyping and Development
Prototypes created using illustrator(low fidelity) and HTML(high fidelity)
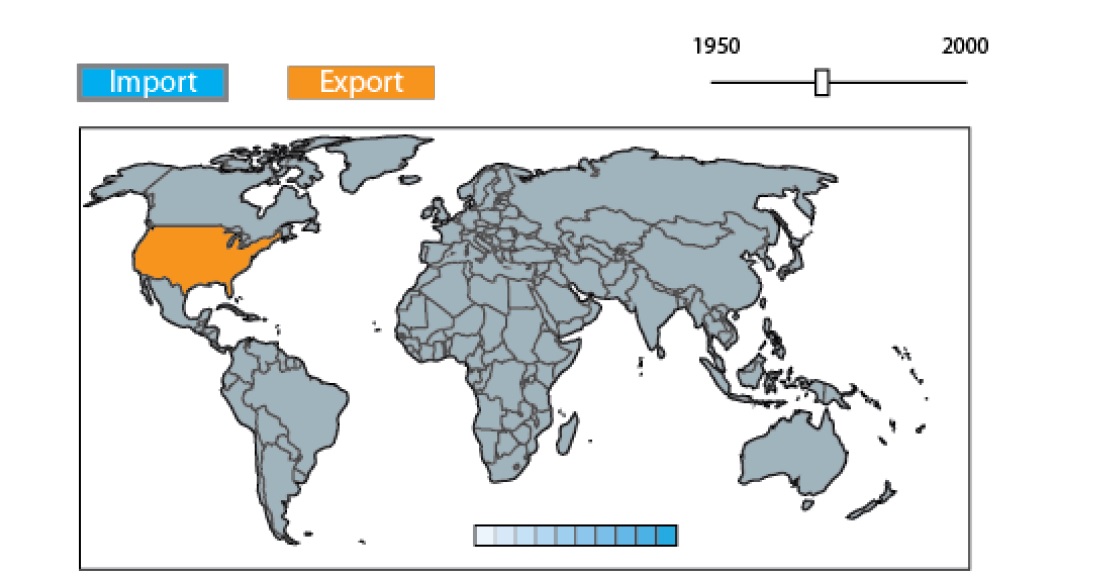
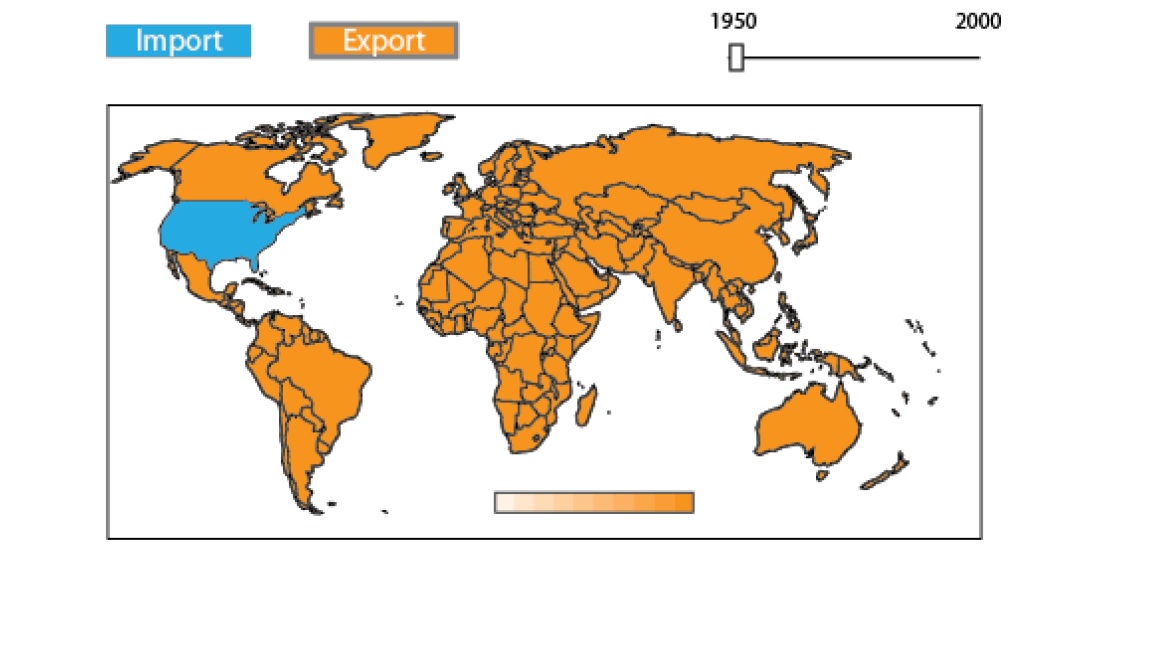
I first tested a heatmap solution where the exports towards a certain country would change in opacity.
Using a scroll bar, time periods would show how the exports or imports would change towards more or less for the country.
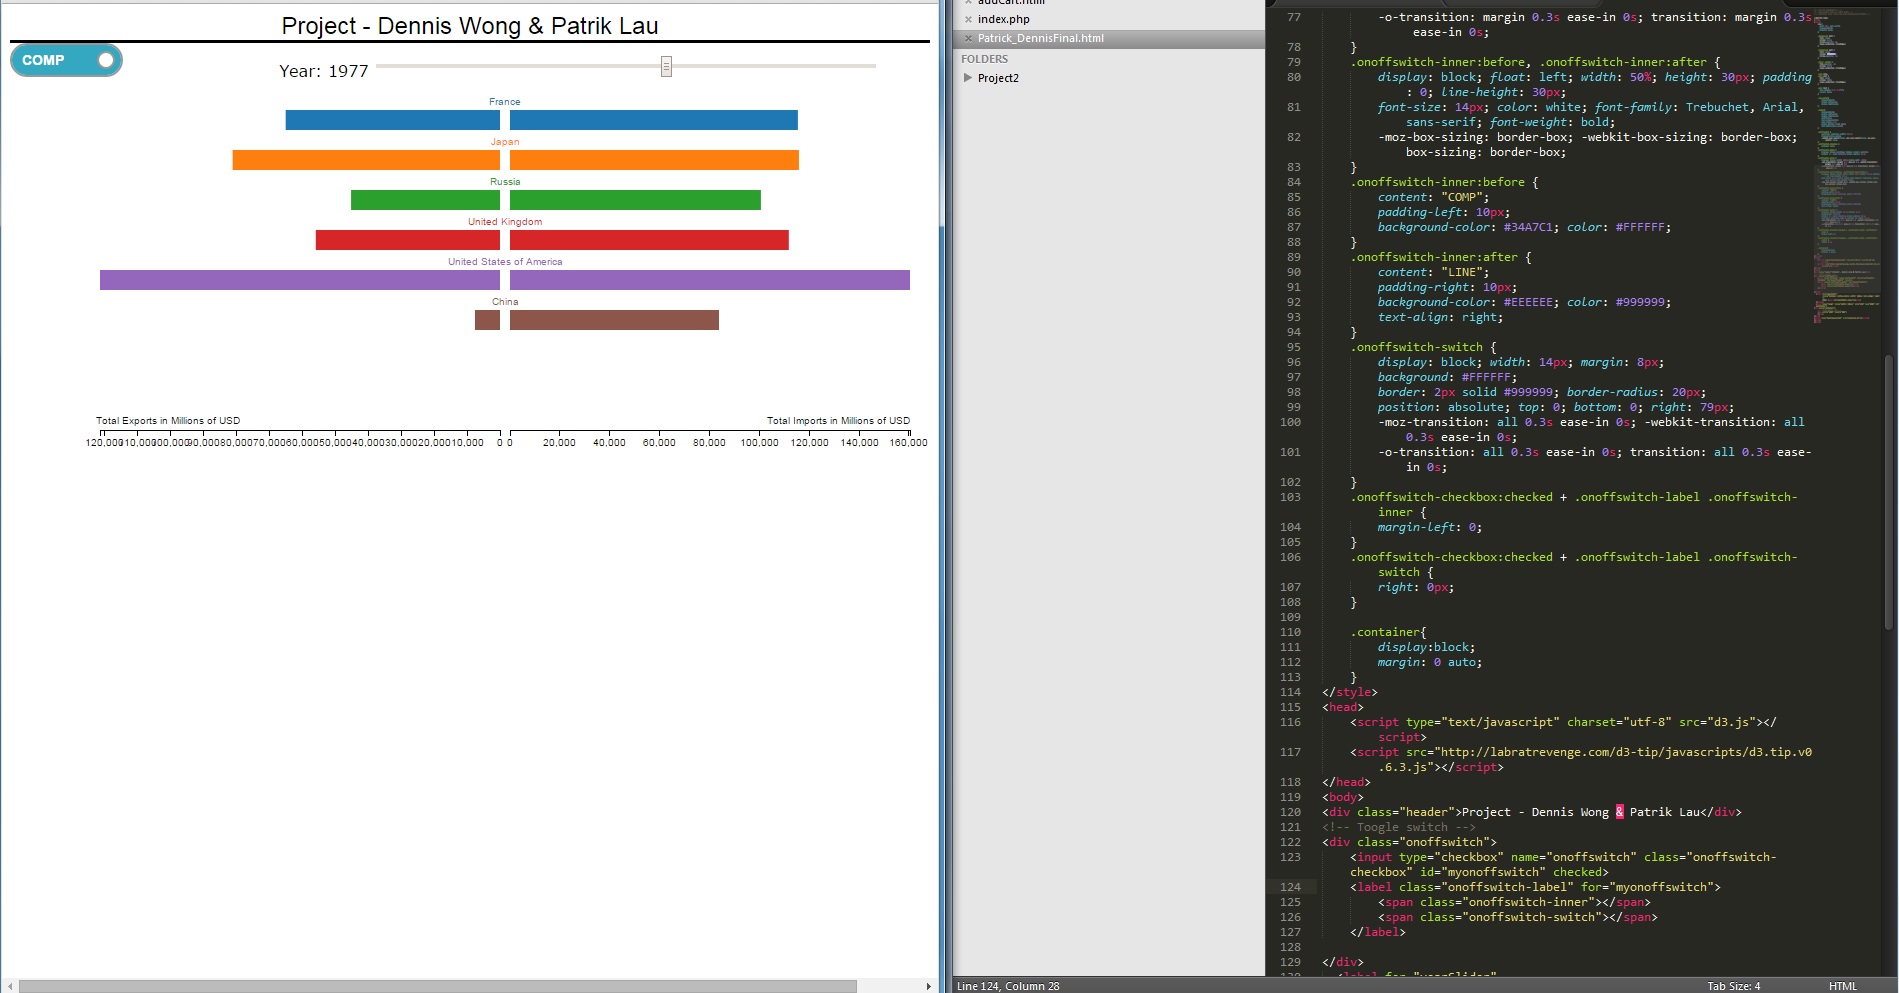
Code snippets of the html and javascript for the barchart
JavaScript with D3 was used to sort the large raw data available to isolate the most important data to the correct selections. Higher fidelity prototypes were created then to show visually how it would all put together.
Final Iteration
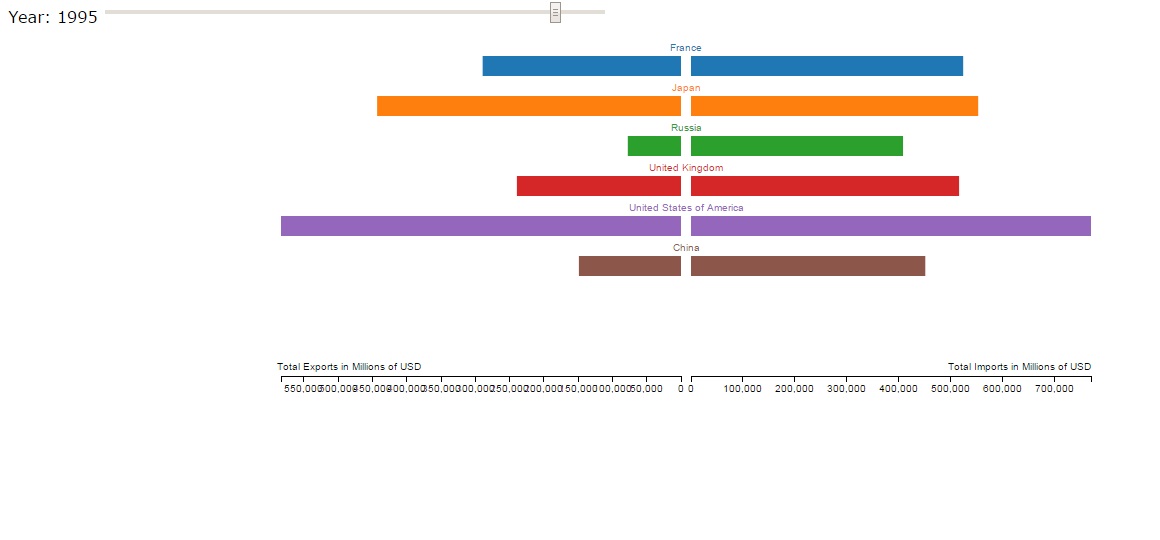
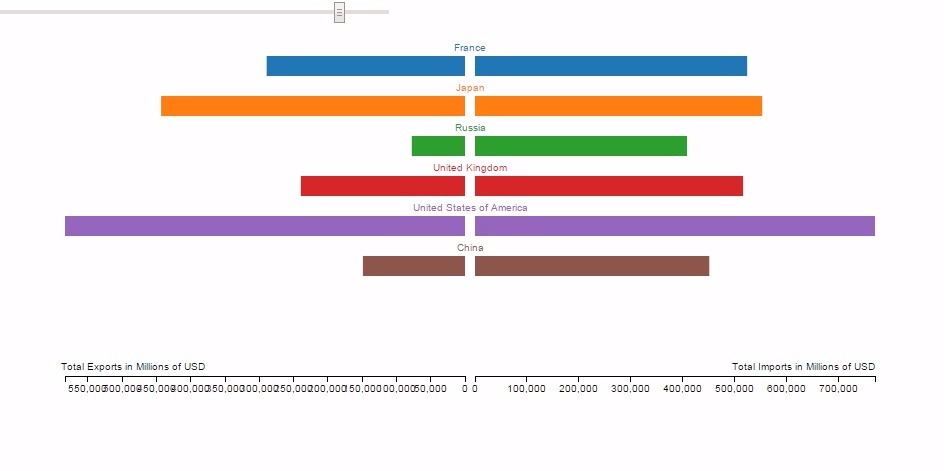
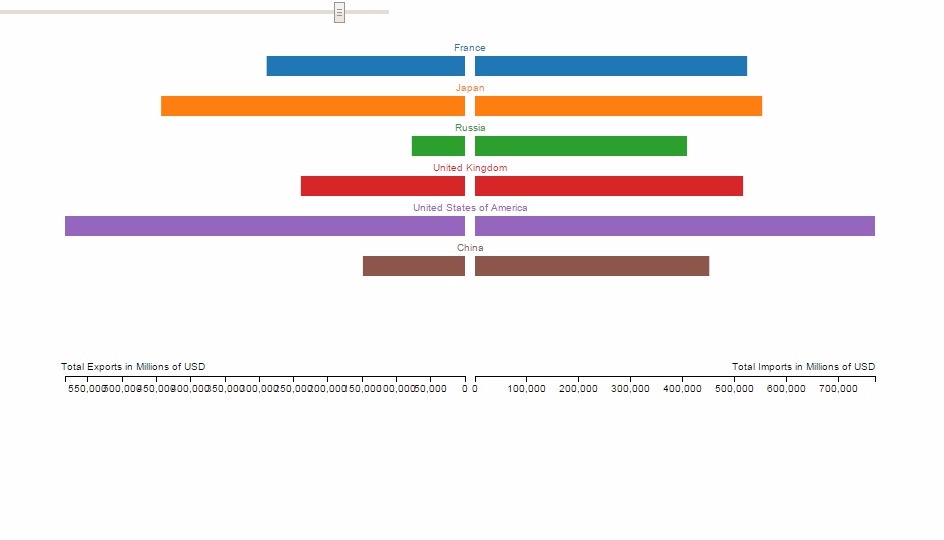
The final rendition is created in HTML and CSS using JavaScript/D3 to process the data automatically.
I chose to use an interactive bar graph instead. It allowed for easy comparisons and that getting the comparison correct was a bigger concern than to add more context in with extras like the heatmap.
Overall I strengthened my ability to realize my designs through the web and am able to capture the intention of someone's wishes correctly.
Please check out the infographic in action:
To Visualization