 |
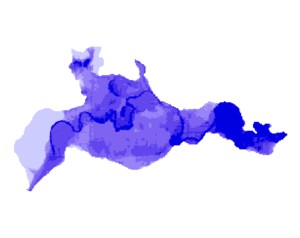
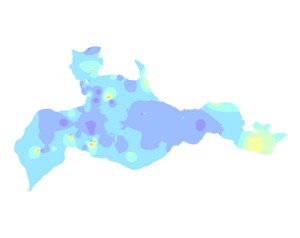
The D parameter represents the depth of the water table below ground surface. As potential contaminants must cross this distance before reaching the groundwater, greater water table depth implies lower vulnerability. Depth to water was taken directly from the static water level data recorded in drillers logs. These values of static water level were imported into ArcMap as point values and interpolated to a 20m x 20m raster grid. The raster was then converted to DRASTIC D-Rating by reclassifying the cells as follows: Depth to water = 0-5ft; D-Rating = 10 (shown as dark purple) Depth to water = 5-15ft; D-Rating = 9 Depth to water = 15-30ft; D-Rating = 7 Depth to water = 30-50ft; D-Rating = 5 Depth to water = 50-75ft; D-Rating = 3 Depth to water = 75-100ft; D-Rating = 2 Depth to water = >100ft; D-Rating = 1 (shown as light purple) |
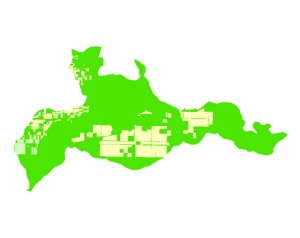 |
The R parameter represents recharge to the aquifer. Recharge is the principal means for leaching and transporting contaminants to the water table; therefore greater recharge increases the likelihood that contaminants will reach the groundwater. Recharge from precipitation (assumed to be relatively homogeneous across the entire aquifer) was added to recharge from irrigation (data and maps provided by the individual irrigation districts in Grand Forks) to produce a polygon coverage which was, in turn, converted to a 20m x 20m raster grid. The raster was then converted to DRASTIC R-Rating by reclassifying the cells as follows: Recharge = 0-2 inches per year; R-Rating = 1 (no such zones identified in Grand Forks) Recharge = 2-4 inches per year; R-Rating = 3 (no such zones identified in Grand Forks) Recharge = 4-7 inches per year; R-Rating = 6 (shown as lime green) Recharge = 7-10 inches per year; R-Rating = 8 (shown as pale green) Recharge = >10 inches per year; R-Rating = 9 (shown as pale yellow) |
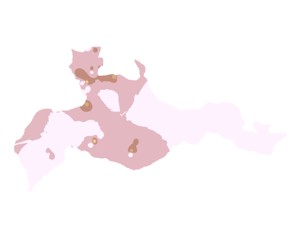 |
The A parameter represents the nature of the aquifer medium. The larger the grain size and the more fractures and openings within an aquifer, the higher the permeability, and thus vulnerability, of that aquifer. Material data was converted to A-Rating on a well-by-well basis with coarser-grained material being assigned higher ratings (gravel corresponded to an A-Rating of 9) and finer-grained material being assigned lower ratings (clay corresponded to an A-Rating of 1). These well-by-well A-Ratings were then converted to an ArcGIS point coverage and subsequently interpolated to a 20m x 20m raster grid. On the map at left, light pink corresponds to A-Rating = 9, plum corresponds to A-Rating = 8 and brown corresponds to A-Rating = 7 (other colours representing lower A-Ratings are present but occupy insignificant portions of the aquifer). |
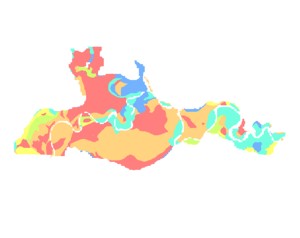 |
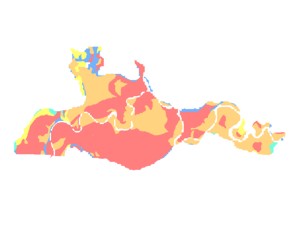
The S parameter represents the influence of soil material on the overall infiltrability of the ground. In general, the less that clays shrink and swell, and the smaller the grain size of the soil, the less permeable the soil will be and the less likely contaminants will be to reach the water table. An existing soil map was digitized to an ArcGIS polygon coverage and S-Ratings applied manually based on the mapped soil types. These were then verified by comparison with other vulnerability studies involving similar soils. This polygon coverage for S-Ratings was then converted to a 20m x 20m raster grid. On the map at left, blue represents S-Rating = 1 (the least infiltrable soil), blue-green represents S-Rating = 5, yellow-green represents S-Rating = 6, yellow represents S-Rating = 8, orange represents S-Rating = 9, and red represents S-Rating = 10 (the most infiltrable soil). |
 |
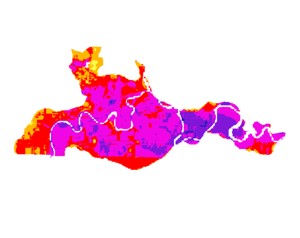
The T parameter represents the effect that the slope of the land surface has on infiltration. On steeper slopes, runoff is typically greater and a given pollutant has an increased chance of being incorporated into that runoff. This reduced likelihood that a contaminant will enter an aquifer in areas with steeper topography therefore implies reduced aquifer vulnerability in such areas. The soil map used in determining S-Rating included average slope for each soil polygon. These slope polygons were sampled to a 20m x 20m raster grid and converted to T-Ratings based on the following slope thresholds: 0-2% slope; T-Rating = 10 (shown as red) 3-5% slope; T-Rating = 9 (shown as orange) 6-9% slope; T-Rating = 5 (shown as yellow) 10-15% slope; T-Rating = 3 (shown as green) >16% slope; T-Rating = 1 (shown as blue) |
 |
The I parameter represents the impact of the vadose (unsaturated) zone material on the overall infiltrability of the ground. The texture of this material influences the ease with which contaminants may pass through it. Finer-grained vadose zone material generally inhibits this movement and therefore implies lower aquifer vulnerability. Material data was converted to I-Rating on a well-by-well basis with coarser-grained material being assigned higher ratings (gravel corresponded to an I-Rating of 9) and finer-grained material being assigned lower ratings (clay corresponded to an I-Rating of 1). These well-by-well I-Ratings were then converted to an ArcGIS point coverage and subsquently interpolated to a 20m x 20m raster grid. On the map at left, dark blue corresponds to I-Rating = 10 (vadose zone absent) and the colour continuum progresses through yellow to red as I-Rating decreases (red corresponds to I-Rating = 1). |
 |
The C parameter represents the hydraulic conductivity (K) of the aquifer medium. This corresponds to the ease with which water (and contaminants) may flow and disperse through the aquifer. Therefore, a medium having greater hydraulic conductivity (permitting higher flow) implies increased aquifer vulnerability. Representative K values were assigned on a well-by-well basis based on material type and these K values subsequently converted to C-Ratings. These well-by-well C-Ratings were then converted to an ArcGIS point coverage and interpolated to a 20m x 20m raster grid. The final assignment of C-Ratings is as follows: Pure gravel and gravel/sand mixtures; C-Rating = 10 (shown as black) Pure sand and gravel/silt mixtures; C-Rating = 4 (shown as beige) Silts, clays, and bedrock; C-Rating = 1 (shown as brown) |
| Results | |
 |
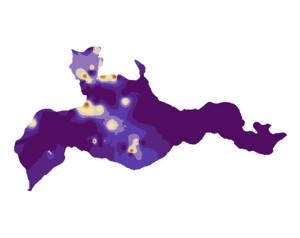
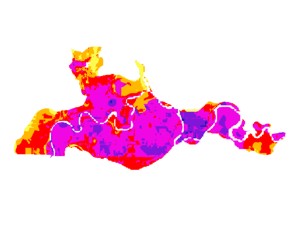
The final DRASTIC map was created by calculating a weighted sum of the individual aquifer attribute rasters within ArcMap. The weight factors used for this were as follows: DRASTIC = 5D + 4R + 3A + 2S + 1T + 5I + 3C The highest DRASTIC value calculated was 210 (shown as purple) while the lowest DRASTIC value calculated was 80 (shown as yellow). Based on the discrete categories for hydrogeologic properties, the highest possible DRASTIC value is 226 while the lowest is 23. |
 |
The PDRASTIC vulnerability mapping method is identical to the standard DRASTIC method but recalibrated to better represent vulnerability to contamination arising solely from pesticide use. This recalibration takes the form of adjusted weight factors as in the equation: PDRASTIC = 5D + 4R + 3A + 5S + 3T + 4I + 2C The highest PDRASTIC value calculated was 241 (shown as purple) while the lowest PDRASTIC value calculated was 95 (shown as yellow). Based on the discrete categories for hydrogeologic properties, the highest possible PDRASTIC value is 256 while the lowest is 26. |